problem
Maths Filler 2
Can you draw the height-time chart as this complicated vessel fills
with water?
Can you match the charts of these functions to the charts of their integrals?
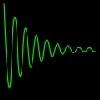
Which line graph, equations and physical processes go together?
This task depends on learners sharing reasoning, listening to opinions, reflecting and pulling ideas together.
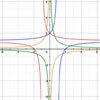
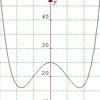
Investigate the graphs of y = [1 + (x - t)^2][1 + (x + t^)2] as the parameter t varies.