Exploring Cubic Functions
Quadratic graphs are very familiar, but what patterns can you explore with cubics?
Problem
Exploring Cubic Functions printable sheet - six graphs and their equations
Exploting Cubic Functions printable sheet - the graphs of fourteen cubic functions
In the GeoGebra applet below, move the slider to change the function.
What stays the same? What changes?
Can you take a guess at what function is being graphed each time?
You can check using the Show Equation box.
Here is a second family of functions to explore. In this case, the three roots sum to zero.
What do you notice about the graphs and their functions?
What do they have in common?
Can you explain any of the patterns that you notice?
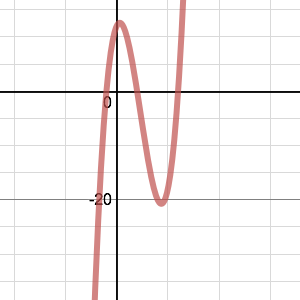
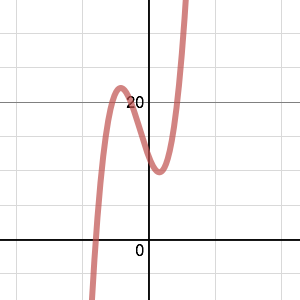
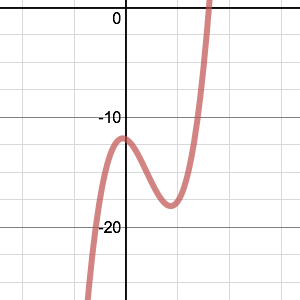
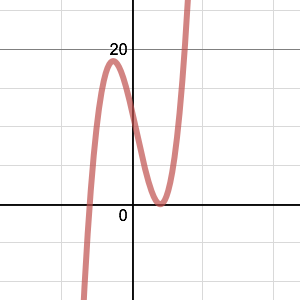
Here are six graphs and their functions. Can you match the functions to their graphs?
| A |
Image
| B | Image
|
| C |
Image
| D | Image
|
| E |
Image
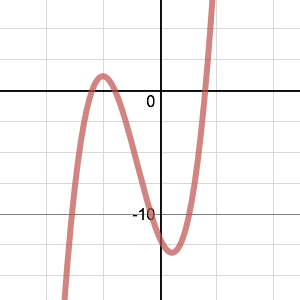
| F | Image
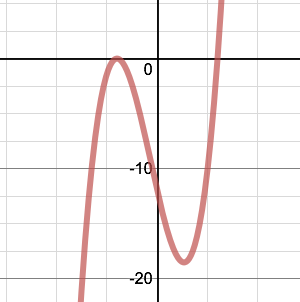
|
(1) $y=x^3+2x^2-5x+12$
(2) $y=x^3+3x^2-4x-12$
(3) $y=x^3-7x^2+4x+12$
(4) $y=x^3-3x^2-x-12$
(5) $y=x^3+x^2-8x-12$
(6) $y=x^3-x^2-8x+12$
And finally...
The illustration below shows the graphs of fourteen functions.
Two of them have equations $$y=(x+6)^3-2$$ $$y=-(x-9)^3+3$$
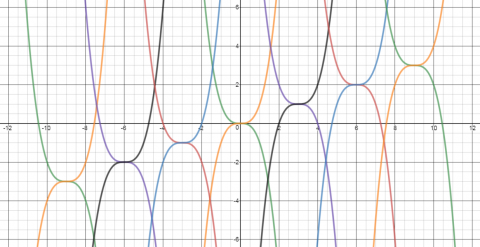
Can you find the equations of the other twelve graphs in this pattern?
Can you create some similar patterns of your own, using different families of cubic functions?
With thanks to Don Steward, whose ideas formed the basis of this problem.
Getting Started
When working with functions and their graphs, here are a few key points to look out for:
Where does the graph cross the $x$ axis? (We call these the roots of the function)
Where does it cross the $y$ axis?
Does the graph have any reflectional or rotational symmetry?
Does the graph have any turning points?
Sketching Graphs - Transformations includes a video about the relationship between functions whose graphs are translations of each other.
When using the GeoGebra applets it might be a good idea to start the slider(s) at 0.
When you have two sliders, you could start by exploring the effect of moving each separately before exploring the effect of moving both together.
Student Solutions
Mahdi from Mahatma Gandhi International School in India, Sanika from PSBBMS, OMR in India and Marianna from Aiglon College in Switzerland described what they saw using the GeoGebra applets. Sanika wrote:
In the first graph, I noticed that the graph always intersected at the origin. The other two intersections were at a particular integer and its respective conjugate. So the roots were $a, -a$ and $0.$ I could then use this to figure out the function. I noticed that as the coefficient of $x$ decreased, the distance between the peaks of the curve from the $x$ axis seemed to increase.
Marianna found the equation and made some more observations:
For the second family of equations, Sanika wrote:
I noticed that both of them always intersected the $x$ axis at 3 distinct places. When either of them was substituted into the function, it gave a result of $0$ (as $y$ is always zero at the $x$ axis). I also observed that if a line were drawn parallel to the $x$ axis through the $y$ intercept, the distance from either of the vertices to the line was equal.
This last observation was described differently by Marianna:
The graph appears to have rotational symmetry with the centre being the $y$ intercept.
Marianna, Sanika and Mahdi also found the equations. This is Mahdi's work:
Since the sum of the roots is $0,$ the coefficient of $x^2$ will be $0.$
To match the equations to the graphs, Sanika and Marianna tried factorising the cubics and using their roots. This is Sanika's work:
| Graph | Equation | Factorised cubic |
| 3 | $(x+1)(x-2)(x-6)$ |
| 1 | $(x+4)(x2-2x+3)$ |
| 4 | $(x-4)(x2+x+3)$ |
| 6 | $(x-2)(x-2)(x+3)$ |
| 2 | $(x+3)(x+2)(x-2)$ |
| 5 | $(x-3)(x+2)(x+2)$ |
Mahdi used a different relationship between the roots of a cubic and its equation:
In the many functions given, if we assume the three roots to be $\alpha ,\beta ,\gamma$ then any general cubic would be of the form: $$f(x) = x^3 - x^2(\alpha+\beta+\gamma)+x(\alpha\beta+\beta\gamma+\alpha\gamma)-\alpha\beta\gamma$$This comes from expanding $(x-\alpha)(x-\beta)(x-\gamma)$
The key strategy that I followed was first to divide the six graphs into two categories:
$y$ intercept equal to $12$: (A), (B), (D) & (1), (3), (6)
$y$ intercept equal to $-12$ (C), (E), (F) & (2), (4), (5)
The second thing I did was to differentiate all of the equations.
Sang-Ryun from The Perse Upper School in the UK also used differentiation. This is Sang-Ryun's work:
I needed to find the values of the two stationary points that appear in every graph. To achieve this, I used single differentiation for each of the equations.
For example, when considering $y= x^3+2x^2-5x+12$ (equation 1)
$\dfrac{\text{d}y}{\text{d}x}=3x^2+4x-5$
As we are required to find the stationary point of this equation, we know that the gradient of this particular point must equal to $0$ (as tangents to stationary point are always horizontal), we can deduce that in equation 1,
$3x^2+4x-5=0$
We can next use the quadratic formula to solve this equation,
$x=\frac{-b\pm \sqrt{b^2-4ac}}{2a}$
$x=\frac{-4\pm\sqrt{4^2-4\times3\times -5}}{2\times 3}$
To 2 decimal places, the result of this calculation results in,
$x=0.78$ and $-2.12$
However, it is clear that knowing these two $x$ values for the graph is not sufficient, as we are not given the $x$ axis scale within the graphs A - F, and so, we must use the full co-ordinate of the stationary points to accurately determine the relative equations of the graphs, so, I substituted the calculated $x$ values into the original equation (1).
$y= 0.78^3+2\times 0.78^2-5\times0.78+12$
OR
$y=(-2.12)^3+2\times(-2.12)^2-5\times(-2.12)+12$
$y=9.79$ and $22.1$ (3s.f)
We can write the final solution for the two stationary points in co-ordinate notation,
$(0.78, 9.79)$ and $(-2.12, 22.1)$
And now, as we now understand the methodology behind this solution, we can use this same principle for all equations 1 - 6, and I have the results written in hand here:
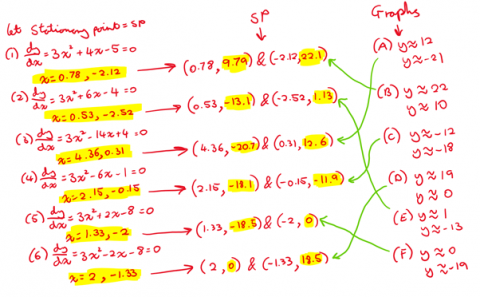
And finally...
Muhammad C from Bolton School Boys' Division, Homare from Wimbledon High School (both in the UK), Mahdi and Sanika found the equations of the graphs which make the pattern. Sanika explained how to find the equations:
The first equation $y=(x+6)^3-2$ clearly increases with the value of $x,$ so the graph will start from the bottom and move to the top. The second equation $y=-(x-9)^3+3$ increases when the value of $x$ decreases, so the graph starts from the top and moves to the bottom.
Substituting $x=-6$ into the first equation I get the coordinate pair $(-6, -2).$ This point is seen in the second graph from the left (in the website's illustration). So that must be the graph satisfying the equation. Since all the graphs that increase with the $x$ coordinate is just the graph $y=(x+6)^3 -2$ [translated] along the $x$ & $y$ axes, we can determine the other equations by adding numbers to the $x$ and $y$ components of the equation. The numbers we are adding/subtracting depends on the number of $x$ & $y$ coordinates the graph has shifted. Consecutive graphs increase 1 unit along the $y$ axis and $3$ units along the $x$ axis.
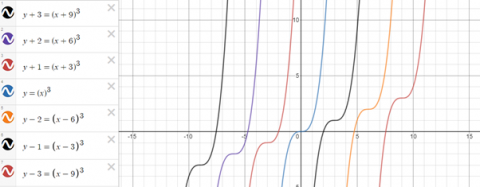
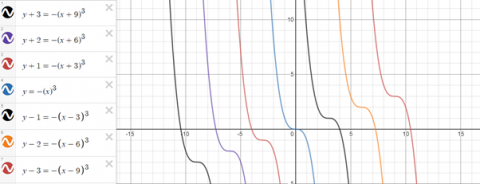
The other set of 7 graphs are just the inverse of the above graphs so they would share the same y coordinates but their x coordinates would differ.
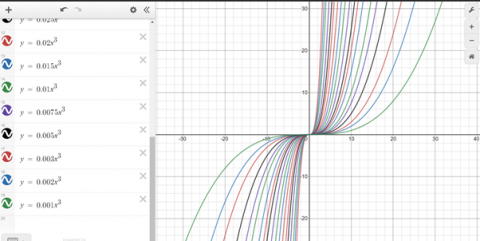
As well as these, Homare and Mahdi created some other patterns using cubics on Desmos. These are Homare's patterns:
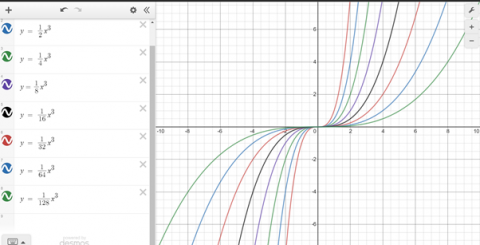
These are the patterns I made using Desmos! The first being a random pattern I did just to make it look nice. The second is $\frac1{2^k}$ (as the coefficient of $x^3$). The second graph shows how quickly the gradient gets less steep.
These are Mahdi's patterns:
Along similar lines (pun intended!), I was able to create one such illustration.
By restricting the domain, a pointy star can be created. This can be repeated as well.
I also made a video of multiple cubics harmoniously oscillating around. It was a lot of fun, really enjoyed it.
Click here to see Mahdi's video.
Teachers' Resources
Why do this problem?
Many maths courses focus in great detail on quadratic functions and their graphs, but cubic functions are often only touched on briefly. This problem takes some particular examples of cubic functions and invites students to explore their graphs.
By switching between different algebraic representations and the graphical representation, students can gain insights that would not be so easily apparent if working purely algebraically. This, along with the scaffolding provided by the interactive GeoGebra applets, allows students to become more resilient in their approach to curve sketching, a topic which many find challenging.
Possible approach
Students will get the most benefit from working on this task if each group has access to tablets or laptops so they can explore the GeoGebra applets. Alternatively, if only one computer and a projector is available, this could be used as a whole class activity, with the teacher moving the sliders and inviting students to notice what happens and make predictions.
Invite students to move the slider on the first applet to change the function, and to write down what they notice. Use the questions in the problem as prompts:
What stays the same?
What changes?
What might the function be?
Draw attention to the roots of the cubic, and the relationship between the function $f(x)=x(x-a)(x+a)$ and the shape of the graph. Invite students to expand the function.
Now move on to the second applet and go through the same process - move the sliders, notice what stays the same and what changes, and then make connections between the key points of interest on the curve (roots, turning points, y-intercept) and the function.
Once students have had plenty of time to explore the applets and gain insights into the relationship between the functions and their graphs, hand out this worksheet and challenge students to match the functions with the graphs. You could finish off the lesson by inviting each group to explain their reasoning.
The final activity in the problem is available on this worksheet, which could be used as a consolidation activity in another lesson or for homework.
Possible support
Students could start by exploring quadratic graphs before moving on to cubics. Parabolic Patterns provides a nice challenge that uses similar thinking.
Key questions
Where does the graph cross the x axis?
Where does it cross the y axis?
Does the graph have any reflectional or rotational symmetry?
Does the graph have any turning points?
Possible extension
Students could explore the graphs of Ellipses in a similar way.
