

Ladybird Count

 1 out of 3
Some children were playing a game. Make a graph or picture to show how many ladybirds each child had.
Problem
Some children were playing a game.
They collected cards with ladybirds on them.
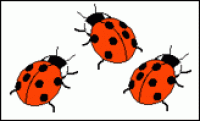
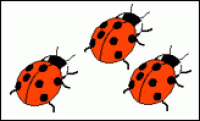
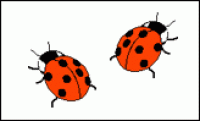
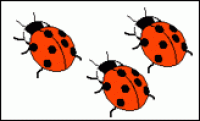
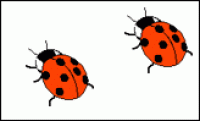
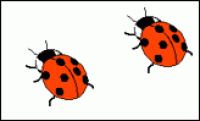
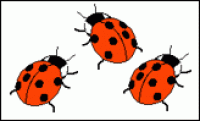
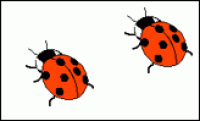
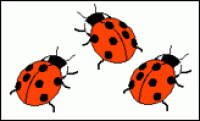
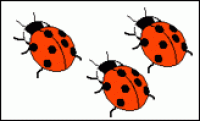
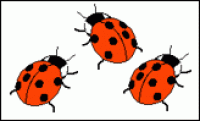
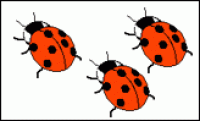
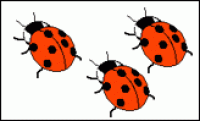
Here are the cards they had at the end of the game:
Aisha:
Image
| Image
|
Image

| Image

|
Ben:
Image
| Image

|
Image
| Image
|
Carmel:
Image
| Image
|
Image
| Image
|
Danny:
Image

| Image

|
Image
| Image

|
Elaine:
Image

| Image
|
Image
| Image
|
You could download and print out this sheet which shows all the children's cards.
What do you notice?
What questions would you like to ask?
Make a graph or picture to show how many ladybirds each child had. We would love to see your creations!
Getting Started
How many ladybirds does each child have?
Student Solutions
We had lots of lovely pictures and diagrams sent in about this task, so thank you to everybody who sent us their solutions.
Taqeeya from ABQ Seeb International School in Oman sent us these ideas:

Well done, Taqeeya - you've noticed lots of interesting things about the different numbers of ladybirds.
Chloe from England also drew pictures of ladybirds to represent how many each child had:

Thank you Chloe, those would be some good questions to ask. I wonder if anyone else has ideas for questions they would like to ask about this game?
Tilly from Haslingfield in the UK drew a bar chart to represent how many ladybirds each child had, and also drew a bar showing all of the ladybirds added together:

Austin from Macedon Primary School in Australia also made a bar chart of these numbers:

Thank you both for sending these in!
Kushagra from SS John and Monica Catholic Primary School in the UK chose to show this data in a different way:

Well done, Kushagra! I like the way this table makes it easy to see how many of each type of card each child has.
Finally, Harry from Copthorne Prep School in the UK looked at the cards the children had and noticed there were lots of things to count and compare, not just the number of ladybirds. He made a table and bar chart showing what he noticed:

Well done for spotting so many things to count, Harry! Can you see any patterns in the numbers you've found?
Teachers' Resources
Using NRICH Tasks Richly describes ways in which teachers and learners can work with NRICH tasks in the classroom.
Why do this problem?
This problem offers children some raw data that they have not had to collect themselves. This has some advantages: you know that everyone has the same information without worrying about the accuracy of their recording methods. This means the focus can be analysis and representation rather than collection.
Possible approach
This activity featured in an NRICH Primary webinar in March 2021.
First, the children need to begin to make sense of the situation. It is probably helpful to ask them to think about the pictures using the 'What do you notice?' and 'What questions would you like to ask?' prompts. (You may find it useful to give out copies of this sheet, which shows pictures of all the children's cards.) Offer them plenty of opportunities to think, without insisting on quick answers.
After they have had this chance, find out their ideas. You will find that children's 'noticings' will be very varied, and try to welcome this individuality. Many comments may not be mathematical, but this does not matter at all at this stage. It is important that learners do not feel that there are right and wrong noticings, instead all their observations are valid.
You could create a list of their questions for all to see. You may find that the question of how many ladybirds each child has comes up naturally, but if not you can choose either to pursue one of the children's own questions, or pose that question yourself.
From this point the problem concentrates on how the data could be represented. Be prepared to consider a variety of responses: the solutions do not need to be bar charts or pictograms. Their suggestions will provide insights into the children's own methods of recording. Engaging in conversation with them about their representation may be essential and this is a great way to probe their previous experiences of handling and recording data.
The resulting representations would make a meaningful display.
Key questions
How many ladybirds does each child have?
How could you show that on a picture or chart?
Possible extension
Some children could be challenged to show the information in more than one way. They may even be able to articulate which representation they think is best and why. In addition, they may like to try to pose and answer their own question about the pictures.
Possible support
Some children may prefer to represent their ideas using media other than paper, for example cubes, counters etc.