

The Pet Graph

 1 out of 3
Tim's class collected data about all their pets. Can you put the animal names under each column in the block graph using the information?
Problem
Tim's class collected information about all their pets. They have six different kinds of pets between them.
This is the block graph they are making to show how many of each pet the class has altogether.
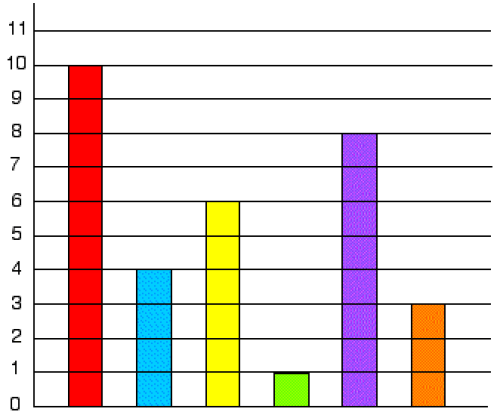
The children have not yet put in the animal names under each column. Can you do this for them using the information below?
There are two less cats than dogs.
Only one child has a parrot at home.
The number of fish added to the number of gerbils is equal to the number of dogs.
There are twice as many fish as hamsters.
There are half the number of gerbils as there are cats.
Getting Started
How many different kinds of pets do the class have between them?
Which bar was the easiest to identify?
Would it help to write down what you know?
Student Solutions
Tina sent us her solution. She tackled the problem logically.
Only one child has a parrot at home, so the green bar must be parrots.
Fish+gerbils=dogs and if you try all the possibilities it must be the red bar for dogs, and the blue and yellow bars for fish and gerbils (but we don't know which way round yet).
There are two less cats than dogs, so the purple bar must be for cats (because we know how many dogs there are now).
So the orange bar must be for hamsters (because all the rest have been matched up, even though we don't know which way round blue and yellow are yet).
There are twice as many fish as hamsters, so the yellow bar must be for fish. So the blue bar must be for gerbils.
There are half the number of gerbils as there are cats- yes, this works!
During lockdown 2020 we received the following from Clemmie who goes to Thomas's London Day Schools.
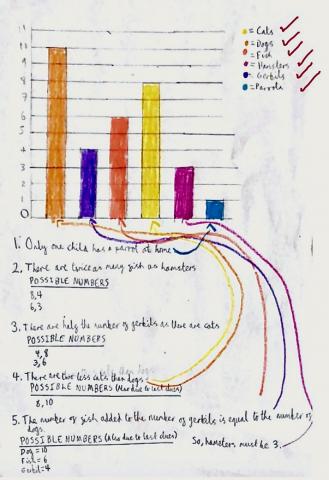
Well done Clemmie, that solution is very well shown in your work.
Teachers' Resources
Using NRICH Tasks Richly describes ways in which teachers and learners can work with NRICH tasks in the classroom.
Why do this problem?
This problem is a simple introduction to bar charts which never-the-less requires both logical working and high level thinking. To be successful learners need to understand what the graph is saying and relating that to the information they have been given.
Key questions
Possible extension
Learners could go on to How Big Are Classes 5, 6 and 7? or You Never Get a Six.