Olympic Records
Can you deduce which Olympic athletics events are represented by the graphs?
Problem
Olympic Records printable sheet - graphs
Here are ten graphs showing how Olympic records have changed over time in ten athletic events.
Can you deduce which event each graph represents?
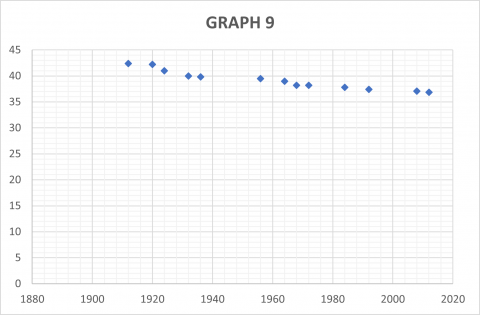
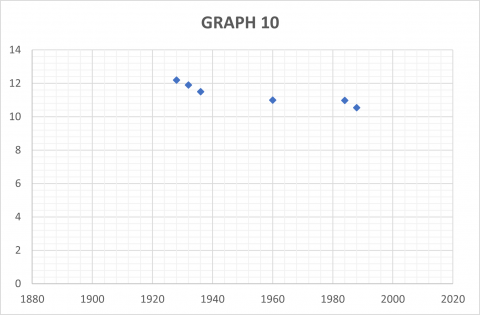
You can click on the thumbnails above to view each graph, or download this pdf or this powerpoint with all the graphs.
Here are some questions to consider, which may help you to make sense of the graphs:
- Can you determine what the units might be on the vertical axis for each graph?
- Why do some graphs show a decreasing trend and some an increasing trend?
- Are there any unusual features in any of the graphs? Can you think of a plausible explanation for them?
Thanks to Alan Parr for suggesting this problem.
Getting Started
This PDF contains a list of the ten events.
Can you match the events to the graphs?
Student Solutions

Patrick, Elliot, Oscar and Peter, Jaa, Lucas and Jerry, Prinn, Xander and Ryan, Pair, Korya, Sasha and Ysabel and Pat and Andrew from Rubgy School Thailand, Edward from Plumstead Manor in England, Seokwon (Andy) from Suzhou Singapore International School in China, Mahdi from Mahatma Gandhi International School in India and Angel from England all identified this event correctly.
Isaac, Mr Robinson and Miss Morgans from St. Joseph's RC Primary School, Newbury in the UK wrote:
First, we looked at all the graphs and deduced that the x-axis was the year of the event and the y-axis was the score/time achieved. We then thought about which events the score was increasing in and which ones decreased. We
thought about the types of events each graph could possibly represent and made some initial suggestions.
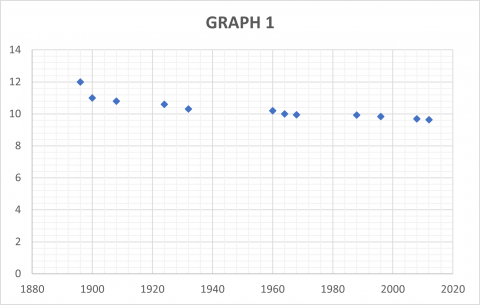
Graph 1: Speed - running
Jaa, Lucas and Jerry explained:
The measurement gets less and less which could maybe show that it is a running event.
Patrick, Elliot, Oscar and Peter wrote:
We believe that the units are in seconds.
We think it is the 100m men's event.
The world record is 9.58 and was set in 2009, but Usain Bolt didn’t do it in the Olympics, but he did it in the World Championships. The OLYMPIC record is 9.63 which was set in 2012, which corresponds to the graph so therefore we know that this is the men's 100m.

Patrick, Elliot, Oscar and Peter, Jaa, Lucas and Jerry, Prinn, Xander and Ryan, Pair, Korya, Sasha and Ysabel and Pat and Andrew, Edward, Seokwon (Andy), Mahdi and Angel all identified this event correctly.
Pat and Andrew wrote:
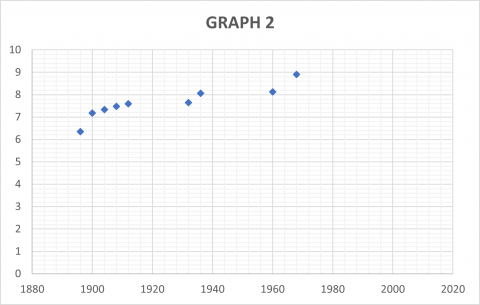
I think the unit is a meter because the record keeps going up.
Prinn, Xander and Ryan wrote:
At first we thought about the sports which are apt for the integers given on the y axis, firstly, I thought that it would be javelin, conversely it was brought to light after doing some research that the Olympic record for the javelin is over 90 metres, then this alluded us to think about the different categories for jumps, resulting in doing a little bit of research on the high and long jump.
Angel wrote:
It is because the longest jump was 8.9m and nobody has beaten that ever since which is why the graph finishes in 1968.

Mahdi thought about the y axis units:
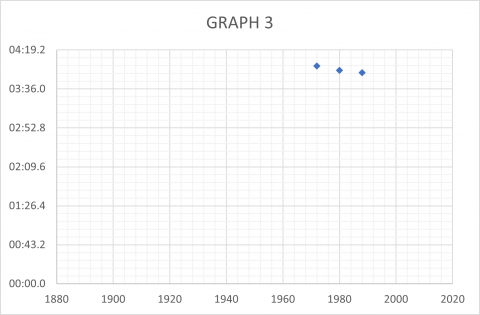
Unit is time, which can suggest that it is either a marathon (if in hours) or a run of 1 or 2 km for 3.5 minutes. I reckon Men's or Women's 1500 metres.
Jaa, Lucas and Jerry made some suggestions based on the x axis:
A new sport due to there only being records from not long ago or it could be a women’s sport due to the Olympics not allowing women to participate a while ago.
Angel, Seokwon (Andy) and Edward identified the graph. Angel and Seokwon (Andy) used the same idea. Angel wrote:
It is [women's 500 metres] because women’s 1500 metres started in 1972 and that’s where the graph starts.
Seokwon (Andy) added:
Identified via the approximate times, and the few number of Olympic records.

Peter, Elliot, Patrick and Oscar, Jaa, Lucas and Jerry, Prinn, Alexander and Ryan, Pair, Korya, Sasha and Ysabel, Edward, Seokwon (Andy), Mahdi and Angel identified this event. Pair, Korya, Sasha and Ysabel wrote:
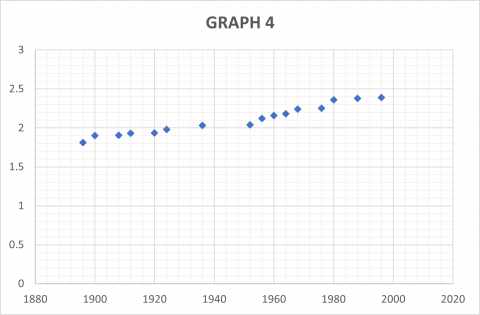
y = meter
High jump - men
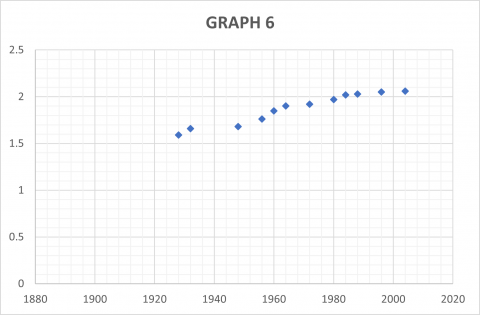
The y value increased over time, so it could measure length. A short length such as 2 metres may have meant the event was a jumping event including height would be most reasonable because 2 metres is too short for specific jumps. Therefore, we think it is a high jump.
Lucas, Jaa and Jerry added:
High jump because the world record in 1994, it was 2.45 meters for men.

Prinn, Xander and Ryan, Pat and Andrew, Edward, Seokwon, Mahdi and Angel correctly identified this event. Prinn, Xander and Ryan wrote:
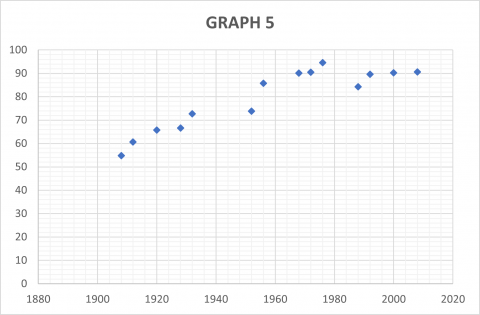
We also think that this is the men's javelin Olympic record, as there was a major rule change to do with javelin just before the 1988 Olympics, which you can see on the graph; the record dropped during the 1988 Olympics, and slowly climbed back up. The current men's Olympic record was set in 2008 and is 90.57 metres.
Seokwon (Andy) investigated the change:
Interesting data point when Olympic Record decreases. Redesign of javelin when almost reaching 100m as danger of javelin going closer to the seating area. Centre of mass altered, so that the javelin sticks into the ground, rather than hoizontally [travelling].

Mahdi, Angel, Seokwon (Andy), Edward, Pat and Andrew and Jaa, Lucas and Jerry correctly identified this event. Angel wrote:
Women's High Jump, because it was similar to the Men’s High Jump and it started later than the Men’s.

Mahdi wrote:
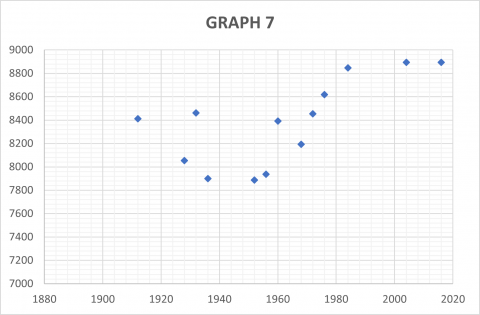
No clue. Confused about the fluctuations and drastic changes too. No trend as well, and hard to guess the units. They don't seem like time or distance, something else completely.
Pat and Andrew, Seokwon (Andy) and Angel worked out the event. Seokwon (Andy) wrote:
Mens Decathlon, on the y-axis points

Jaa, Lucas and Jerry, Pat and Andrew, Edward, Seokwon (Andy), Angel and Mahdi correctly guessed the event. Jaa, Lucas and Jerry wrote:
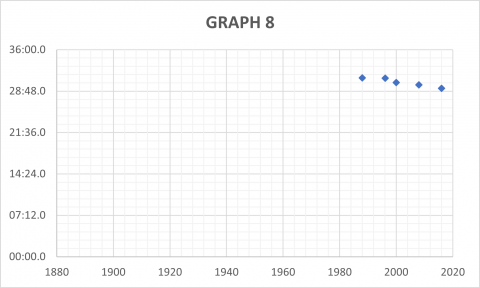
Women’s 10km run because women have recently been able to participate in the Olympics and the scores get lower and lower. The record is also 29:17.45 (held by Almaz Ayana). This applies to the graph.
Unit: Minutes:seconds

Mahdi wrote:
Some sprint, because of the decreasing time, probably? A 40 second record could be for men's 400 metres?
Pat and Andrew, Edward, Seokwon (Andy) and Angel identified the event as Men's 4$\times$100 metres Relay.

Pat and Andrew, Edward, Seokwon (Andy), Angel and Mahdi correctly identified this event. Mahdi wrote:
Probably women's 100 metres. The declining time which is lowest at around 10 seconds can be a good reason for women's 100 metres. However, I wonder if the record isn't broken since 1990 or somewhere around that year.
Angel wrote:
Women’s 100 metres, because it is similar to the men’s and the record hasn’t been broken since 1988.
Teachers' Resources
Why do this problem?
This problem gives students the opportunity to make sense of graphical data and challenges them to apply their own knowledge about athletics to explain and interpret key features of the graphs.
Possible approach
Arrange the class in groups of three or four, and give each group the ten graphs.
While they are working, circulate and listen to their reasoning. If some groups are stuck, here are some useful prompts:
- What can you deduce about the event if the record increases over time?
- What about events where the record decreases over time?
After they have had sufficient time to consider the graphs, ask them to write down a list of what events they think each represents.
Possible support
You may wish to hand out this list of the events and ask students to work out which belongs with each of the ten graphs.
Alternatively, this card sort activity contains the ten graphs and the events on cards for students to match up.
Possible extension
Ask students to carry out some extra research in order to explain unusual features in the graphs, such as:
- Drastic changes
- Long gaps
- Absence of data in the early twentieth century
- Records that go both up and down
Students could create their own set of graphs and challenge the rest of the class to work out which Olympic athletics events they relate to.
