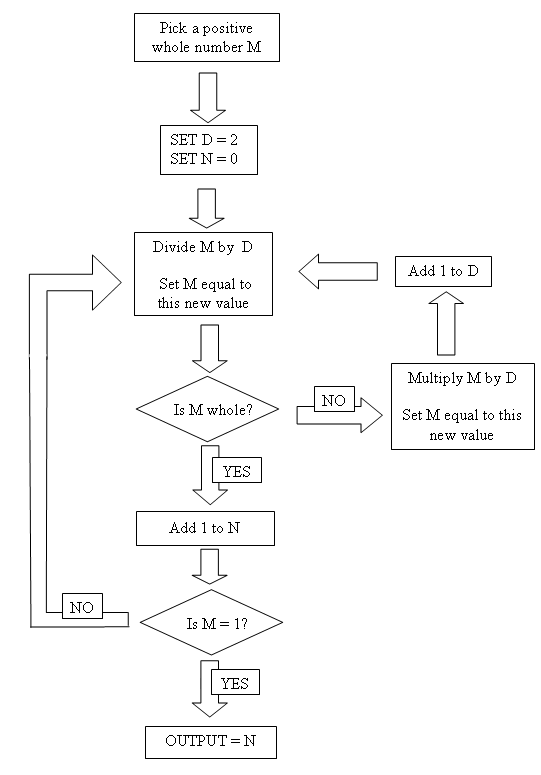
Flow Chart
The flow chart requires two numbers, M and N. Select several values for M and try to establish what the flow chart does.
Problem
Flow charts give very precise instructions, to perform a task or calculation.
The flow chart below uses three variables of which you can choose the starting value for M.
Select several values for M and try to establish what the flow chart does.
You might like to look at a printable version of the flow chart.

If you start with certain numbers you reach the OUTPUT fairly quickly, but if you start with other numbers you don't.
e.g. if you start with 144 you reach the OUTPUT a lot sooner than if you start with 145.
What is special about the numbers that lead to an OUTPUT quickly?
What is special about the numbers that don't?
Certain values of D divide exactly into M during the procedure?
What is special about these values of D?
What is special about the value of N that you end up with?
How can the flow chart help you determine whether M is prime?
Getting Started
Use a table of values to keep track of M, D and N as they change.
Student Solutions
Vivek from UWCSEA showed a very clear understanding of what the flow chart does:
The numbers that don't, have very large prime factors.
Teachers' Resources
Why do this problem?
This problem is about flow charts, factors and prime factorisation.
Possible approach
Teachers can present the flow chart to students and ask them to try to figure out what to do with it. A table of values can be drawn on the board to collect results.
There won't be an obvious algebraic relationship emerging but this might be a good opportunity to emphasise the need to look at the underlying mathematics rather than just the values. Discussion with the group can draw out comments and observations about what the flow chart is doing.
Students can then be directed to the questions in the problem.
If the group hasn't had much experience of using flow charts, some time could be set aside to discuss the merits of flow charts (efficient, clear, unambiguous) and some of their drawbacks (repetitive, tedious - try starting with a large prime number!).
Possible extension
Possible support
