

Birdwatch

 1 out of 3
Have a look at this data from the RSPB 2011 Birdwatch. What can you say about the data?
Problem
Every year, the Royal Society for the Protection of Birds (RSPB) asks people to do a survey of the birds seen in their gardens. In 2011, over half a million people took part and you can see some of the results the RSPB received in the two tables below:
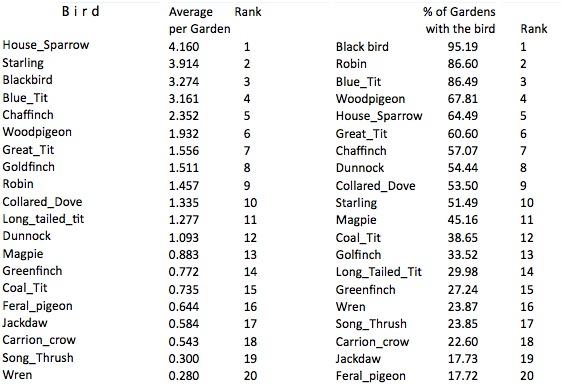
The first column of both tables shows the names of the birds. The second column of the left-hand table shows the average numbers of those birds across all the gardens. The second column of the right-hand table shows the percentage of all the gardens in which those birds were identified.
Image text description
For accessibility:
The first table has the headings: Bird, Average per Garden, and Rank. The entries in the table in order of rank from 1 to 20 are: House Sparrow, 4.160. Starling, 3.914. Blackbird, 3.274. Blue Tit, 3.161. Chaffinch, 2.352. Woodpigeon, 1.932. Great tit, 1.556. Goldfinch, 1.511. Robin, 1.457. Collared dove, 1.335. Long-tailed tit, 1.277. Dunnock, 1.093. Magpie, 0.883. Greenfinch, 0.772. Coal tit, 0.735. Feral pigeon, 0.644. Jackdaw, 0.584. Carrion crow, 0.543. Song thrush, 0.300. Wren, 0.280.
The second table includes the information Bird, Percent of Gardens with the bird, and rank. The entries in the table in order of rank from 1 to 20, are: black bird, 95.19. Robin 86.60. Blue tit, 86.49. Woodpigeon, 67.81. House sparrow, 64.49. Great tit, 60.60. Chaffinch, 57.07. Dunnock, 54.44. Collared dove, 53.50. Starling, 51.49. Magpie, 45.16. Coal tit, 38.65. Goldfinch, 33.52. Long tailed tit, 29.98. Greenfinch, 27.24. Wren, 23.87. Song thrush, 23.85. Carrion crow, 22.60. Jackdaw, 17.73. Feral pigeon, 17.72.
You may need to have a chat with others to get a clear picture of the meanings of "average per garden' and "percentage of gardens with the bird".
Have a general look at both tables. What can you say about them?
What can you can about the ranking of the starling?
What can you say about the ranking of the robin?
Getting Started
This is definitely an activity to try with others so you can talk about your ideas.
You may like to look up more information on the RSPB Birdwatch website.
Student Solutions
Well done to Jordan and Kane from Aspendale Gardens Primary School, Victoria in Australia who sent in this excellent solution!
The table on the left is about the average per garden, while the one on the right is about the percent of gardens with the bird.
The Carrion Crow is amazingly ranked $18$th on each table.
About half of the gardens have Starlings.
The Starling is ranked $2$nd in the left table but ranked $10$th in the percentage table.
The Robin has an average of just under $1.5$ and is ranked $9$th.
The Robin is ranked pretty high in the right table.
Based on the table on the right the robin was more common than the starling across the gardens. There were $86.60$% of gardens with robins but only just over half with starlings.
However the other table shows that more starlings were seen in each garden than robins.
This means that starlings aren't as common as robins but there are more of them seen in gardens on average.
Well done to everyone who investigated this problem!
Teachers' Resources
Using NRICH Tasks Richly describes ways in which teachers and learners can work with NRICH tasks in the classroom.
Why do this problem?
This activity gives pupils an opportunity to engage in fruitful discussion about data presented to them. It gives a forum for a whole group or class discussion, and provides a situation where pupils need to listen carefully to what others are saying, and follow the thinking behind what has been said.
Possible approach
The activity is one which probably works best as a discussion among a group or class. There will be a need to refer to the data throughout so some form of display could be necessary and it might be helpful to print off copies of the data on this sheet.
It may be that through the discussion, some questions arise, perhaps about the data itself or about the reasons behind the results presented in the data. These questions may lead to groups of children collecting further data or conducting research in an attempt to obtain answers.
This activity is also useful to help pupils learn about what is important when having a discussion where others have ideas that may then be validated and accepted or rejected. This, of course requires the development of good listening skills.
Key questions
Why do you say that?
What do others think about that?
Possible extension
Explore other websites that produce child-friendly data and encourage learners to decide what to interrogate and what data collection to pursue.
Possible support
Try to step back as the children discuss the data. Depending on their experience, you may need to act as a 'chairperson' and encourage all to contribute.