Birdwatch
Have a look at this data from the RSPB 2011 Birdwatch. What can you say about the data?
Problem
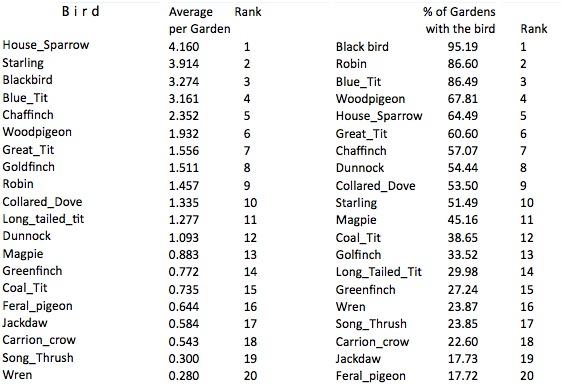
Every year, the Royal Society for the Protection of Birds (RSPB) asks people to do a survey of the birds seen in their gardens. In 2011, over half a million people took part and you can see some of the results the RSPB received in the two tables below:

The first column of both tables shows the names of the birds. The second column of the left-hand table shows the average numbers of those birds across all the gardens. The second column of the right-hand table shows the percentage of all the gardens in which those birds were identified.
For accessibility:
The first table has the headings: Bird, Average per Garden, and Rank. The entries in the table in order of rank from 1 to 20 are: House Sparrow, 4.160. Starling, 3.914. Blackbird, 3.274. Blue Tit, 3.161. Chaffinch, 2.352. Woodpigeon, 1.932. Great tit, 1.556. Goldfinch, 1.511. Robin, 1.457. Collared dove, 1.335. Long-tailed tit, 1.277. Dunnock, 1.093. Magpie, 0.883. Greenfinch, 0.772. Coal tit, 0.735. Feral pigeon, 0.644. Jackdaw, 0.584. Carrion crow, 0.543. Song thrush, 0.300. Wren, 0.280.
The second table includes the information Bird, Percent of Gardens with the bird, and rank. The entries in the table in order of rank from 1 to 20, are: black bird, 95.19. Robin 86.60. Blue tit, 86.49. Woodpigeon, 67.81. House sparrow, 64.49. Great tit, 60.60. Chaffinch, 57.07. Dunnock, 54.44. Collared dove, 53.50. Starling, 51.49. Magpie, 45.16. Coal tit, 38.65. Goldfinch, 33.52. Long tailed tit, 29.98. Greenfinch, 27.24. Wren, 23.87. Song thrush, 23.85. Carrion crow, 22.60. Jackdaw, 17.73. Feral pigeon, 17.72.
You may need to have a chat with others to get a clear picture of the meanings of "average per garden' and "percentage of gardens with the bird".
Have a general look at both tables. What can you say about them?
What can you can about the ranking of the starling?
What can you say about the ranking of the robin?
Getting Started
This is definitely an activity to try with others so you can talk about your ideas.
You may like to look up more information on the RSPB Birdwatch website.
Student Solutions
Well done to Jordan and Kane from Aspendale Gardens Primary School, Victoria in Australia who sent in this excellent solution!
The table on the left is about the average per garden, while the one on the right is about the percent of gardens with the bird.
The Carrion Crow is amazingly ranked $18$th on each table.
About half of the gardens have Starlings.
The Starling is ranked $2$nd in the left table but ranked $10$th in the percentage table.
The Robin has an average of just under $1.5$ and is ranked $9$th.
The Robin is ranked pretty high in the right table.
Based on the table on the right the robin was more common than the starling across the gardens. There were $86.60$% of gardens with robins but only just over half with starlings.
However the other table shows that more starlings were seen in each garden than robins.
This means that starlings aren't as common as robins but there are more of them seen in gardens on average.
Well done to everyone who investigated this problem!
Teachers' Resources
Why do this problem?
