Spots and Measles
99% of people who have measles have spots. Ben has spots. Do you think he has measles?
Problem
This resource is part of the collection Probability and Evidence.
99% of people who have measles have spots. If Ben has red spots, how likely do you think it is it that he has measles?
Here are three pieces of information that might help you to work out this probability:
- There are about 12 million children in the UK.
- About 1,200 of these get measles every year.
- Roughly 10% of the 12 million children suffer from spots.
How might you be able to use this information to be able to calculate the probability that Ben has measles?
Are there any tables or diagrams that might help you represent this information?
Click below to see a possible method for organising the information:
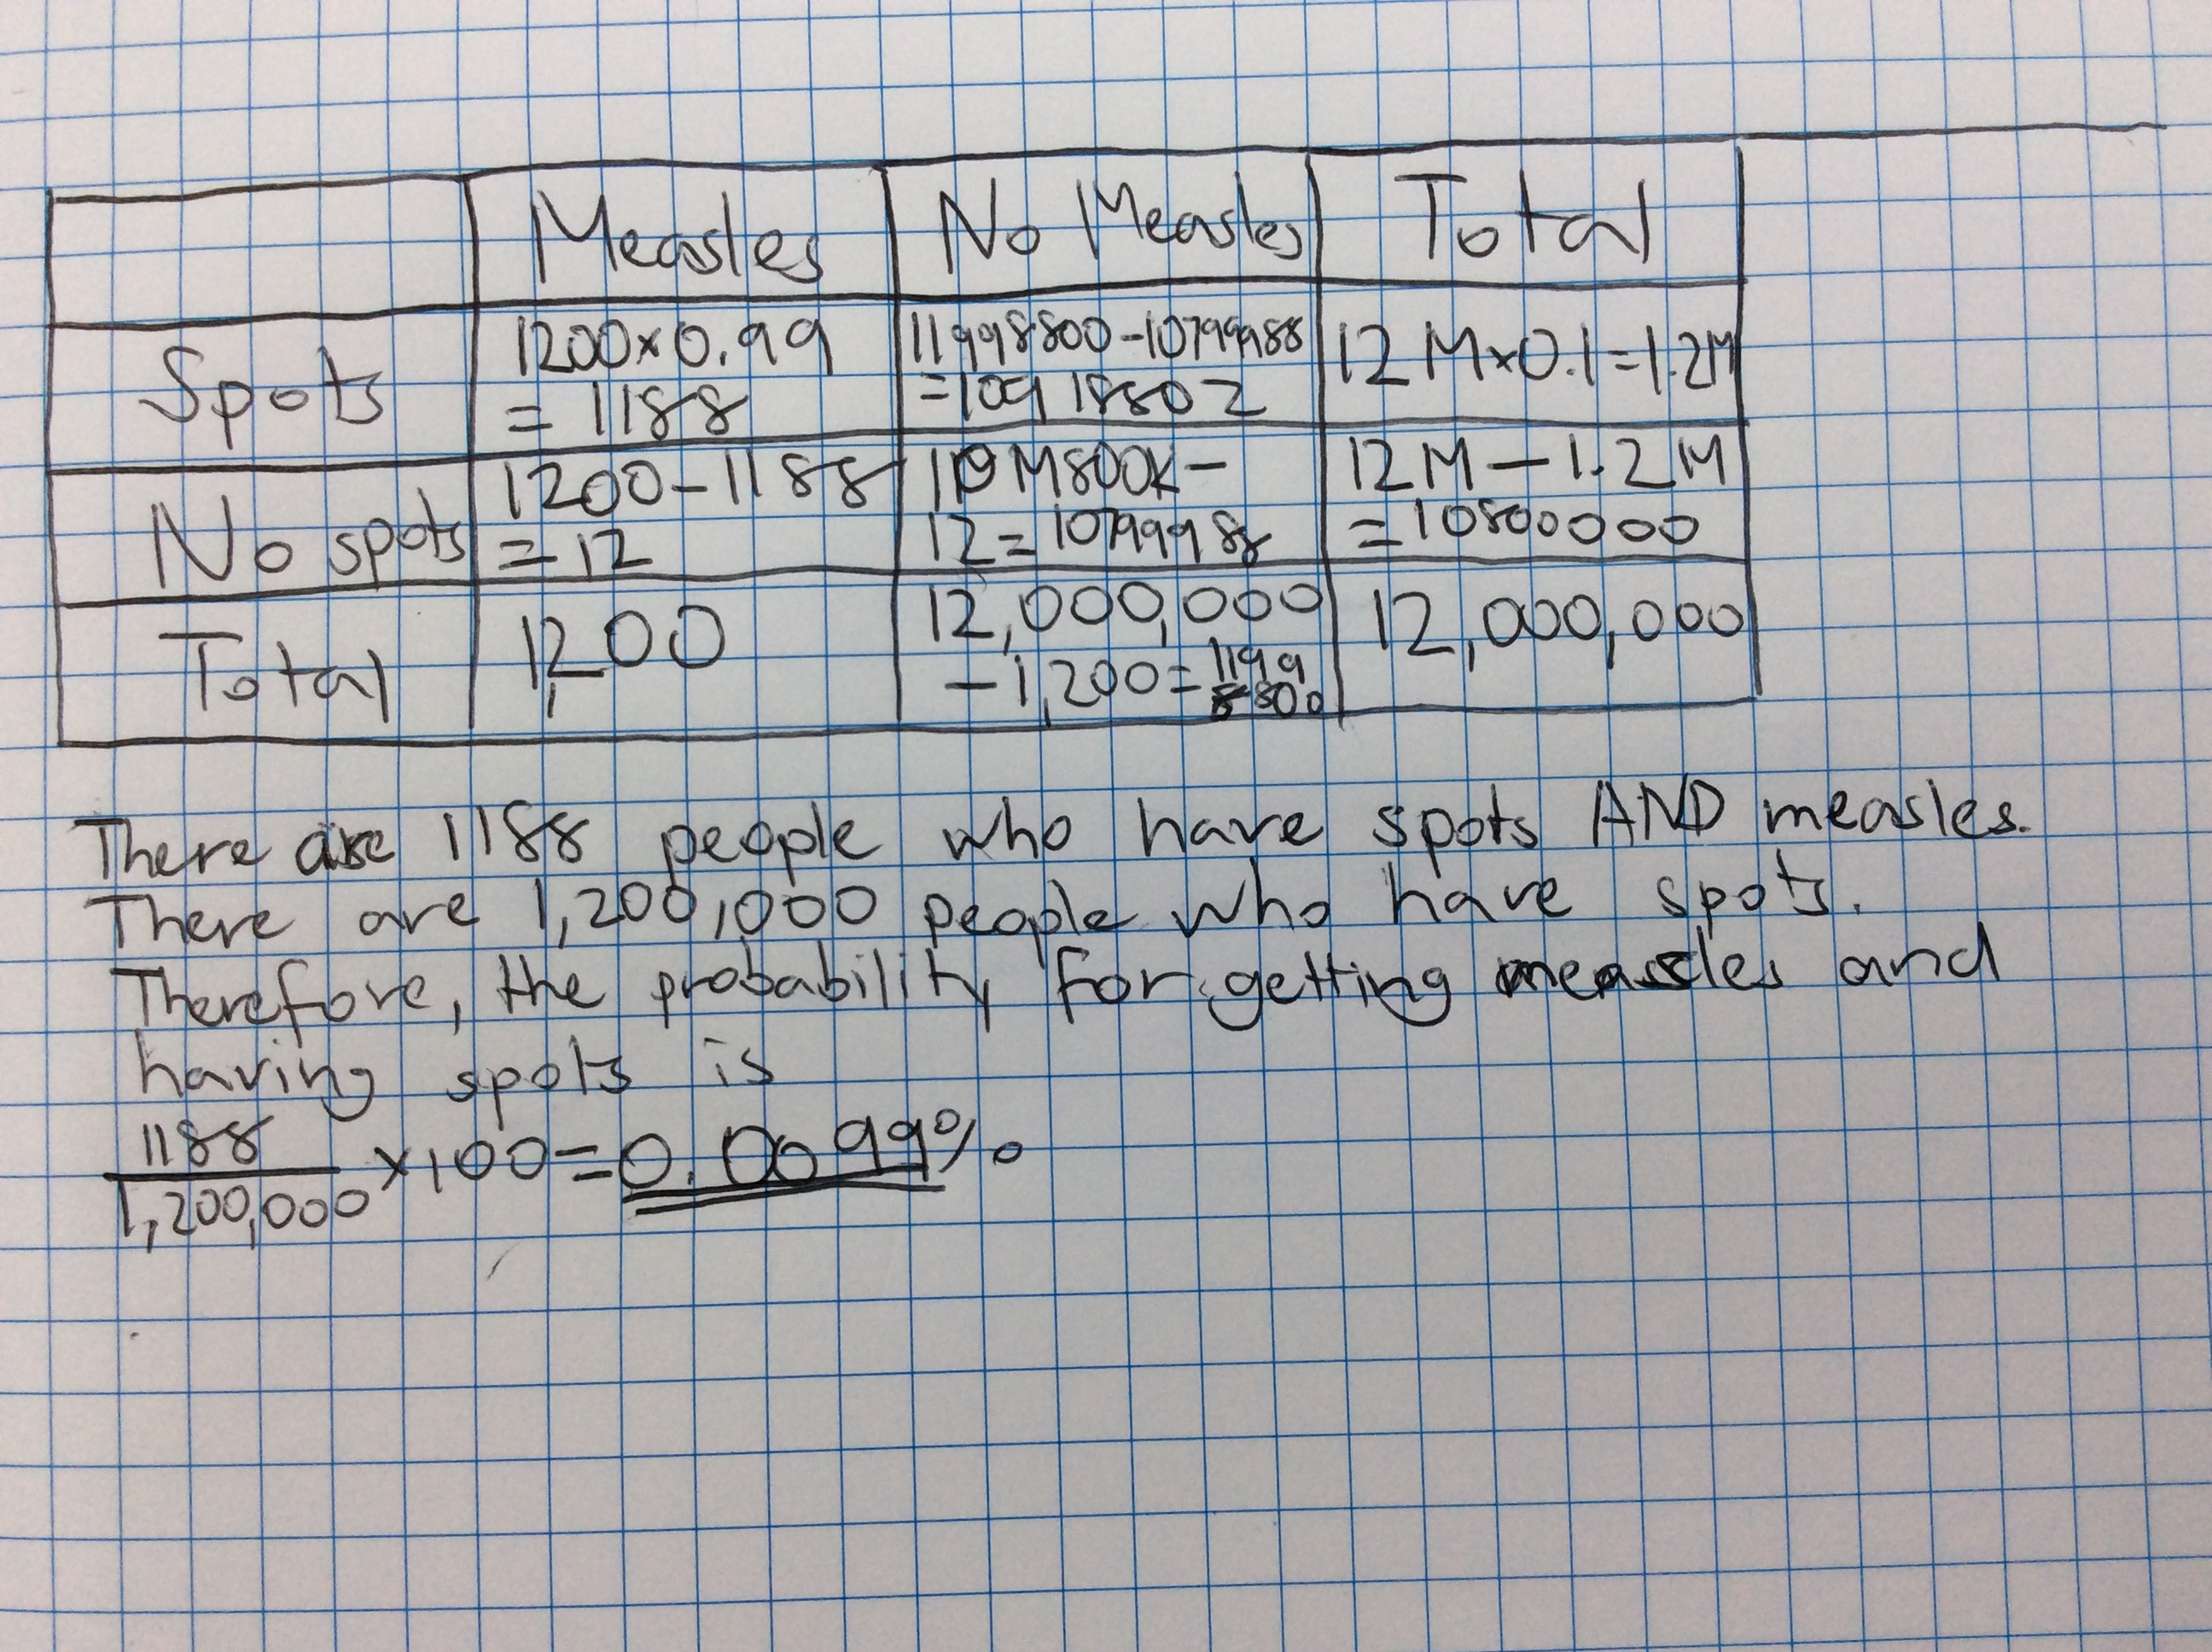
You could draw a two-way (or contingency) table like this.
| Measles | Not Measles | Total | |
|---|---|---|---|
| Spots | |||
| No Spots | |||
| Total | 12 000 000 |
Can you use the information to complete the table?
Can you now work out the probability that Ben has measles?
Are there any other factors that might affect the probability that Ben has measles?
How could you factor these into the calculations?
Student Solutions
Well done to students from Garden International School in Malaysia who used a two-way table to organise the data. Keishiro wrote up her answer neatly and Daigo showed his working out.
Zach wrote up his findings in a very clear way. He also thought about other factors that could affect the probability.
Thank you to everyone who submitted a solution.
Teachers' Resources
Using NRICH Tasks Richly describes ways in which teachers and learners can work with NRICH tasks in the classroom.
Why do this problem?
This problem helps students to distinguish between two related probabilities, the probability of A given B and the probability of B given A. It also suggests an approach for finding the alternative conditional probability using realistic assumptions and a two-way table structure.
Possible approach
This problem follows on neatly from the Probability and evidence: introductory video. After watching the video, students could be asked what their initial estimate of the likelihood of Ben having measles is and what they have based this on. They could also be asked to suggest what further information they would need to work out a more accurate estimate. If specific quantities are requested, they could be given.
Once students have all the information they think they will need or all the information given in the question (whichever is the lesser!), they can be split into groups of 2 or 3 and challenged to calculate a probability. If more information is needed, it should become apparent at this stage. The Show/Hide panel on the problem page suggests a two-way table but students may attempt to use a frequency tree diagram or a Venn diagram successfully. Those who don't have their own ideas of how to get started may be shown the Show/Hide panel or may ask for suggestions from other groups.
When students have arrived at an answer, they should explain their reasoning clearly as well as any other quantities they have calculated along the way. They should also be given the opportunity to compare solutions with other groups. If the end result is different, they can work together to reach a consensus; if the result is the same, but the approach is different, they can discuss the merits of each approach.