Spot the difference
If you plot these graphs they may look the same, but are they?
Problem
I used a graphical package to draw these 3 pairs of curves on the same set of axes:
$x + y -1 =0\quad\mbox{and}\quad (x+y-1)(x^2+y^2)=0$
$x + y = 0\quad\mbox{and}\quad (x + y)(y^2+(x+1)^2)=0$
$x + y = 1\quad\mbox{and}\quad x^3 + 3xy + y^3 = 1$
I was surprised to find that only 2 graphs appeared to show on the output:
Image
Can you explain what has happened? Can you work out which curves go with which lines? Are there any points missing from the graphs? If so, where should these be?
Can you think of any others sets of curves which might fool the computer?
Getting Started
In this problem there are three equations of straight lines and three more complicated relations between x and y.
Consider all the factors of the non-linear expressions to discover what points lie on their graphs.
The more complicated relations have extra points (x, y) which satisfy the relations but the computer does not notice.You have to be cleverer than the computer and find the extra points satisfying the relation that do not show up on the computer's graph. To do this you need to look at all the factors in the expressions and find when they are zero.
Student Solutions
Chieh Lung from Kolej Tuanku Jaafar school made a good start on this:
$x + y -1 =0$ and $x + y = 1$ are the same equation, they give the top line, running through $(1,0),(0.5,0.5)$ and $(0,1)$.$x + y = 0$ is the lower line, running through the origin.
The rest of the equations must just be multiples of these.
$(x+y-1)(x^2+y^2)=0$. The solutions of this are like solving a quadratic equation, when solutions are when at least one of the brackets is equal to zero. Here the first bracket is the top line, and the second only has solutions at $(0,0)$ as we are in the real numbers.
$(x + y)(y^2+(x+1)^2)=0$. The first bracket is the top line
through the origin, and the second only has solutions at $(-1,0)$,
as we are in real numbers.
$x^3 + 3xy + y^3 = 1$. This must also be a product of the lines and points. But I cannot find them.
Good start Chieh, Adam finished off your working;
I looked for solutions to $x^3 + 3xy + y^3 = 1$. I found
$(1,0), (0.5,0.5)$ and $(0,1)$. So I thought a factor would be $x +
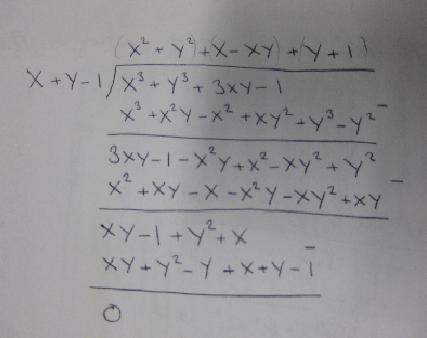
y -1$, so I solved this with long division.
Image

So you can see that $x^3 + y^3 +3xy -1 = (x +y)(x^2+y^2+x+y-xy+1)$
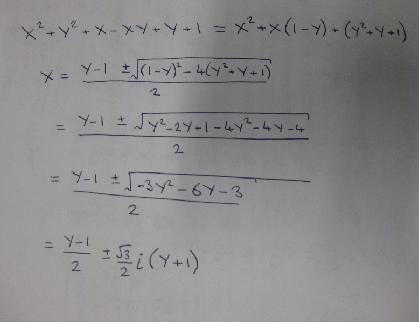
To see if $x^2+y^2+x+y-xy+1$ has any solutions I wrote it as a quadratic in $x$ and used the quadratic formula.
Image

As you can see the solutions are imaginary, they contain an $i$. So The second bit can only equal zero at specifc points, not a whole line. So another point at $(-1,-1)$.
So the graphs of these six functions either lie on two lines, or have single discrete solutions, and so the effect of just two visable lines is achieved.
This effect could be created many times by choosing two lines, and then multiplying them by points (say $x^2+y^2=0$).
Teachers' Resources
Why do this problem?
The problem reinforces everything already learnt about straight lines and also highlights the interplay of algebra and geometry.It is good experience for learners to realise that they have to be cleverer than the computer and they cannot blindly accept what it reveals at 'face value'. When people make conjectures about situations and test their ideas on a computer they still have to consider whether the computer evidence is reliable.
The examples with factors $x^2+y^2=0$ and $y^2 +(x+1)^2 = 0$ merely require finding the real solutions of the equations $x^2+y^2=0$ and $y^2 +(x+1)^2$ and interpreting these as points on the graphs.
Experience with these two parts should suggest that in the final relation it is necessary to factorise the equation of the relation.
Possible approach
The Hint should be sufficient to enable learners to tackle the
first 5 equations independently, which can be done for homework or
as a lesson starter.
The class will then be thinking along the right lines when
they tackle the final equation. Class discussion can heighten
awareness that the graphs of relations can have several branches
and that we need to use algebra to find all the solutions as the
computer does not necessarily show all possibilities. Learners
should also be aware that there may be branches that are not shown
on the scale used so they might find other branches by changing the
scale on the axes
Key questions
- What is a linear equation?
- Should we expect the graph of a relation to be a straight line if the equation is not 'linear'?
- Why would the computer fail to show all the points of the graph?
- How do we use the factors of an algebraic expression to find out when it takes the value zero?
Possible extension
Plot these graphs on a graphical calculator or computer
graphics package. Can you think of a single relation which would
produce the graph shown in the question? Can you think of a
relation which would only show differences to those on the screen
when the scales of the graphs are magnified greatly? How might a
computer cleverly be programmed to try to spot more branches of a
relation?
