Slippery slopes
When you transform a function, what can you work out about the gradient?
Problem
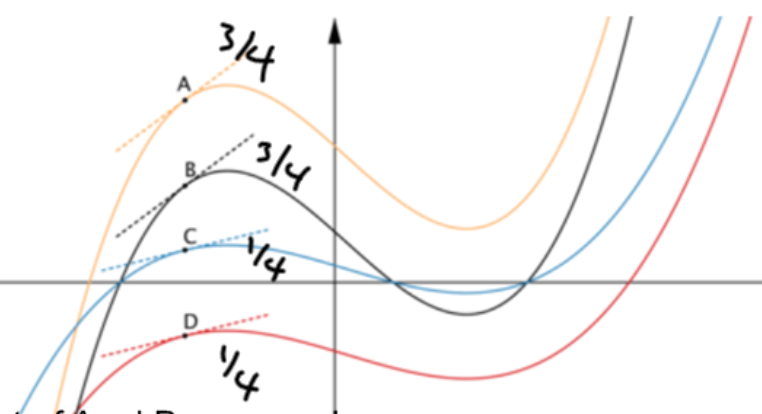
Here are the graphs of four functions. The equations of the graphs are
$$y=f(x) \quad y=f(x)-8 \quad y=3f(x) \quad \text{and} \quad y=3f(x)+8.$$
Image

- The $x$-coordinates of $A$, $B$, $C$ and $D$ are all the same. What can you deduce about the gradients of the curves at $A$, $B$, $C$ and $D$?
- The gradient of the tangent at $D$ is $\tfrac{1}{4}$. What are the gradients of the tangents at $A$, $B$ and $C$?
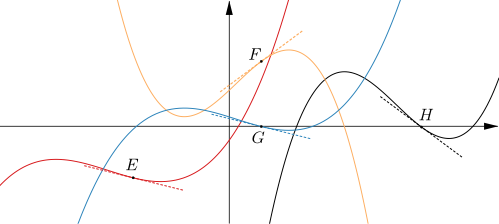
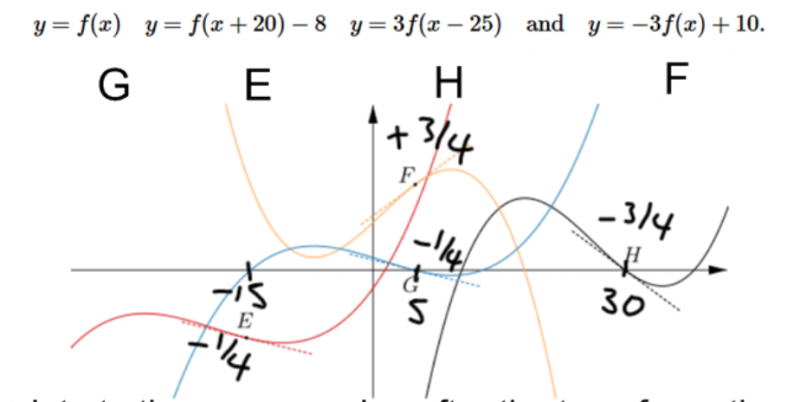
Here are the graphs of another four functions. The equations of these graphs are $$y=f(x)\quad y=f(x+20)-8 \quad y=3f(x-25) \quad \text{and} \quad y=-3f(x)+10.$$
Image

- The $x$-coordinates of points $E$, $F$, $G$ and $H$ are $-15$, $5$, $5$ and $30$ respectively. What can you deduce about these points?
- The gradient of the tangent at $E$ is $-\tfrac{1}{4}.$ What are the gradients of the tangents at $F$, $G$ and $H$?
This is an Underground Mathematics resource.
Underground Mathematics is hosted by Cambridge Mathematics. The project was originally funded by a grant from the UK Department for Education to provide free web-based resources that support the teaching and learning of post-16 mathematics.
Visit the site at undergroundmathematics.org to find more resources, which also offer suggestions, solutions and teacher notes to help with their use in the classroom.
Student Solutions
Thank you to Sophie, Mimi, Hannah and Emma from Sandbach High School who submitted the answers to this problem in the diagrams below:
Image

Image

Thank you also to Melissa who has given explanations for how she arrived at her answers:
First part:
The graphs are all transformations of $y = f(x)$ so $y = 3 f(x)$ and $y = 3f(x) + 8$ can be easily spotted as the lines with steeper gradients, with $y = 3f(x) + 8$ being higher up on the graph. Similarly, of $y = f(x)$ and $y = f(x) - 8$, $y = f(x) - 8$ is the line which is seen to be lower down on the graph. So the yellow, black, blue and red lines show $y = 3f(x) + 8$, $y = 3f(x)$, $y = f(x)$ and $y = f(x) - 8$ respectively.
A and B will have gradients three times as large as the gradients of C and D because for each increase by one in the x value, 3f(x) increases by three times as much as f(x) does.
This means that when the gradient of D is $\frac{1}{4}$, the gradient of C is also $\frac{1}{4}$ and the gradients of A and B are $3\times\frac{1}{4} = \frac{3}{4}$.
Second part:
The yellow line has been reflected in the x axis compared with the others because it starts off decreasing whereas the others begin increasing. Therefore the yellow line is $y = -3f(x) + 10$.
The black line has the same gradient as the yellow line, which is a steeper gradient than the others so the black shows $y = 3f(x - 25)$.
The red line is further left than the blue line so the red line shows $y = f(x + 20)-8$ and the blue line shows $y = f(x)$.
The points E, F, G and H are the same point translated from the original curve, which can easily be seen by looking at how far horizontally and vertically the points E, F and G have been translated from H.
The gradient at E is $-\frac{1}{4}$ so the gradient at G is also $-\frac{1}{4}$ because $y = f(x + 20)$ has the same shape as $y = f(x)$, it is translated but not stretched. The gradient at H is $-\frac{3}{4}$ because the graph $y = 3f(x - 25)$ has been stretched along the y axis by a scale factor of 3 from $y = f(x)$ so the gradient is three times that of G. The gradient at F is $\frac{3}{4}$ because the gradient is the same as at H but is positive.

