MathsJam Jars
Imagine different shaped vessels being filled. Can you work out what the graphs of the water level should look like?
Problem
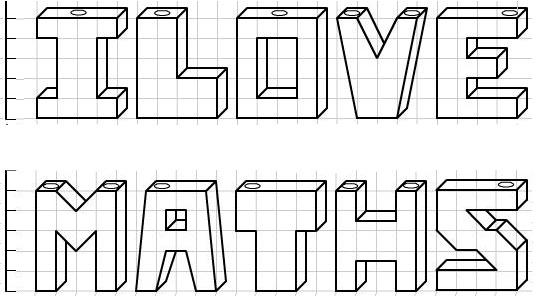
A series of jam jars of uniform cross section look like letters when viewed face-on. They are 1cm thick, and the corners of the vessels have either whole or half cm values for their coordinates.

Hot, smooth jam is poured slowly into each vessel through one of the holes at the top at a rate of 1 cm$^3$ per second.
Seven of the jam jars take the same time to fill up. Which are they?
Which one takes the longest to fill?
Which would fill up first?
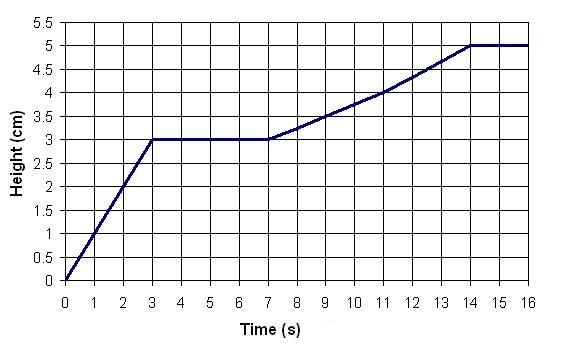
The height of the jam in one of the vessels is measured and a chart of the height against time is plotted, as follows:

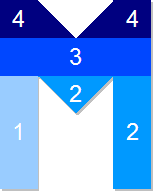
Which jam jars does this chart correspond to? Can you explain what each part of the chart corresponds to?
The very observant jam maker might have noticed that the chart given is actually slightly inaccurate: at certain points it is an over-measurement and at certain points it is an under-measurement. Can you see where and why?
Make charts of height against time for some of the other letters.
p.s. If you feel the need to question the 'runnyness' of the jam, we can assume that it is of low viscosity, contains no 'bits' and remains at the same temperature throughout. You can decide on the flavour. You might also like thinking about this problem.
Getting Started
Does it help to work out the cross sectional area of each letter?
Can you picture how full each letter would be if one cubic centimetre of jam was poured in? What about two cubic centimetres?
Student Solutions
Well done to Anurag and Christina for their solutions to this problem:
The seven letters that take the same time to fill up are: I,L,O,E,M,T and H, all with a volume $14$cm$^3$ and thus taking $14$ minutes to fill.
The letter S takes the longest to fill up ($14.5$cm$^3$, $14.5$ minutes to fill).
The letter V fills up first ($13$cm$^3$, $13$ minutes to fill).
The letter A will take $13.5$ minutes to fill.
The graph corresponds to the letter M. Some points in the graph are over measured, for instance, the points between 4 and 5 cm.

Teachers' Resources
You can find Teachers' Notes for this problem here.
