How confident are you?
What proportion of people make 90% confident guesses which actually contain the correct answer?
Problem
Image

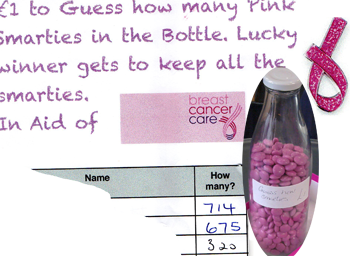
Fill a container with jelly beans (or similar small items) and ask as many people as possible to guess how many there are
- but don't just ask them for a simple guess!
Ask them to specify a range which they are 90% sure contains the right answer.
So for instance if you look at the container of sweets and think there's probably somewhere around 600, you might say you think there are 9 chances out of 10 that the correct answer is between 500 and 700.
Image

Image

Now count the number of sweets in the container.
How many of the guessed intervals contained the right answer?
Are you surprised at what you find?
Teachers' Resources
Why do this problem?
This problem provides an experimental context in which to introduce the language of probability and to estimate probabilities, while investigating an interesting phenomenon - that in some cases, a crowd acting as individuals often make better decisions than the individuals of which it is made.
This also provides a context to discuss what is meant by a weather forecast that the chance of rain the next day is 70%.
A 70% chance of rain for a particular location in a given time interval means that there are 7 chances in 10 that it will rain in that location in that time interval.
More about this ...
More about this ...
Possible approach
Provide a transparent container which is full of small sweets or other small items - there should be too many for anyone to be able to estimate how many there are at all easily.
Tell the students to survey as many people as possible, asking them to make an estimate of the number of sweets in the container in the form:
I think there are 9 chances out of 10 that there are ... sweets in the jar.
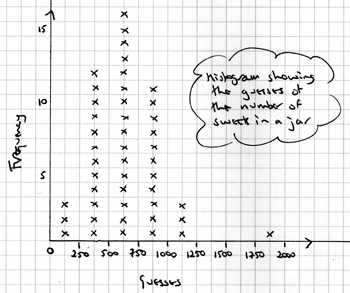
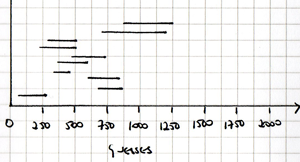
Students should record the guesses, then display them as a range on a graph. If desired, the mid-points of the ranges could also be displayed on a histogram.
Key questions
How many people gave a range which contained the correct answer?What proportion do you think this should be?
How do you explain any discrepancies?
What does 9 chances out of 10 mean? This is an opportunity to discuss the numerical probability scale.
Possible extension
This technique can be applied to weather forecasts, climate change models, and much else. The language of probability provides a way to indicate the degree of confidence which a prediction provides.The Intergovernmental Panel on Climate Change has ranking scales:
| Confidence Terminology | Degree of confidence of being right |
|---|---|
| Very high confidence | At least 9 out of 10 chance |
| High confidence | About 8 out of 10 chance |
| Medium confidence | About 5 out of 10 chance |
| Low confidence | About 2 out of 10 chance |
| Very low confidence | Less than 1 out of 10 chance |
| Likelihood Terminology | Likelihood of the occurrence/outcome |
|---|---|
| Virtually certain | > 99% probability |
| Extremely likely | > 95% probability |
| Very likely | > 90% probability |
| Likely | > 66% probability |
| More likely than not | > 50% probability |
| About as likely as not | 33 to 66% probability |
| Unlikely | < 33% probability |
| Very unlikely | < 10% probability |
| Extremely unlikely | < 5% probability |
| Exceptionally unlikely | <1 % probability |
Possible support
There are two aspects of this problem which may cause some difficult.
One is the amount of data collected. It may help students if they do any work by hand on a small sample of the data, and use a spreadsheet to deal with the complete data set.
The language of probability can be challenging conceptually - we often use language in an imprecise way, and don't think carefully enough about how we express ourselves. Students should be encouraged to be precise in words when they talk about probabilities before moving into any calculation.
