Curve Match
Which curve is which, and how would you plan a route to pass between them?
Problem
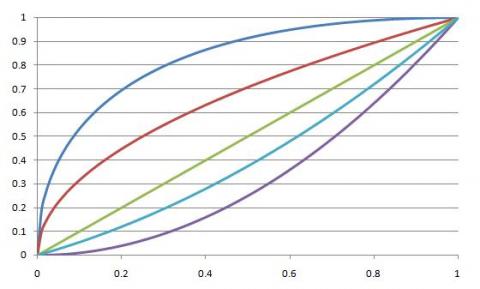
The following five functions have been plotted accurately on the chart below
$$y=\sqrt{x}\quad\quad y=x^2\quad\quad y=x\quad\quad y=(x^2+x)/2\quad\quad y=2\sqrt{x}-x$$

Which is the $x$-axis and which is the $y$-axis? Which curves correspond to which functions?
Imagine that you wish to plot a route between $(0, 0)$ and $(1, 1)$. Can you find a function which does this without intersecting any of the existing curves, except at the endpoints?
What other curves can you plot which only intersect the existing curves at the end points?
Getting Started
The green graph should be straightforward to identify.
A little bit of numerical detective work should help you to identify which axis is which.
Student Solutions
We really liked this solution sent in from Alex from Stoke on Trent Sixth Form College:
The horizontal axis is the $x$-axis, and the vertical axis the $y$-axis.
I used $x=0.5$ to calculate the y values and ordered them.
The curves, from top to bottom on the graph, are the functions arranged in decreasing order of $y$ value for any $x$ value between $0$ and $1$ when they are equal.
The order becomes $2\sqrt{x}-x\,,\sqrt{x}\,, x\,, (x^2+x)/2\,, x^2$
Any function of the form $x^n, n> 2$ will return smaller $y$ values than $x^2$ between $0$ and $1$; avoiding the existing curves and intersect at the end points. $x^{\frac{1}{n}}\,, n> 2$ is similar, instead returning values higher than $x^{\frac{1}{2}}$.
Functions of this form also meet the conditions. To generate a curve $c(x)$ such that $a(x) < c(x) < b(x)$ for $0 < x < 1$, and $a(0) = b(0) = c(0), a(1) = b(1) = c(1)$, the arithmetic mean could be used. $c(x) = (a(x)+b(x))/2$, or a more general $c(x) = a(x) + k(b(x)-a(x)), 0 < k < 1.$ $k = 0.5$ becomes the arithmetic mean. This formula can be used with $a(x)$ and $b(x)$ as adjacent existing curves (such as $a(x) = x, b(x) = \sqrt{x}$). The existing functions $\sqrt{x}$ and $(x^2+x)/2$ could be thought of as having been generating by using $2\sqrt{x}-x$ and $x$, and $x$ and $x^2$, respectively. $a(x) = 0, b(x) = x^2$, and $a(x) = 2\sqrt{x}-x$, $b(x) = 1$ produces $c(x)$ curves below and above existing curves.
Resulting $c(x)$ functions from using the general formulae (or the specific arithmetic mean case) can be used as the $a(x)$ or $b(x)$ functions in generating others, resulting in many different functions involving $x, \sqrt{x}$ and $x^2$ terms.
However, there are other functions in addition that meet the conditions, such as the binary logarithm. $y = \ln(x+1)/\ln(2) = \log_2(x+1)$ Between $0$ and $1$, $x < \log _2(x+1) < \sqrt{x}$, therefore it does not intersect the curves except for the end points where: $\log_2(0+1) = 0$ and $\log_2(1+1) = 1$.
Simon said
Teachers' Resources
Why do this problem?
This challenge could be used as a lesson starter to check students' ability to match curves with their equations. Finding other functions which do not intersect with the existing curves except at the endpoints can help students to develop a stronger sense of how to manipulate functions and the corresponding effect on the graph.
Possible approach
Key questions
Possible extension
Come up with ways of generating curves between any pair on the grid, and prove that there are no intersections except at the end points.
Possible support
Work numerically to plot a few key points for each given function, and use these to identify the $x$ and $y$ axes and each curve.
