List

Being Collaborative - Primary Statistics

Venn diagrams
problem
Favourite

Venn diagrams

Age
5 to 11
Challenge level
filled star empty star empty star

How will you complete these interactive Venn diagrams?

Sticky Data
problem
Favourite

Sticky Data

Age
5 to 7
Challenge level
filled star empty star empty star
You'll need to work in a group on this problem. Use your sticky notes to show the answer to questions such as 'how many girls are there in your group?'.
If the World Were a Village
problem
Favourite

If the World Were a Village

Age
5 to 11
Challenge level
filled star empty star empty star

This activity is based on data in the book 'If the World Were a Village'. How will you represent your chosen data for maximum effect?

Carroll Diagrams
problem
Favourite

Carroll Diagrams

Age
5 to 11
Challenge level
filled star empty star empty star

Use the interactivities to fill in these Carroll diagrams. How do you know where to place the numbers?

Real Statistics
problem
Favourite

Real Statistics

Age
7 to 11
Challenge level
filled star empty star empty star

Have a look at this table of how children travel to school. How does it compare with children in your class?
Birdwatch
problem
Favourite

Birdwatch

Age
7 to 11
Challenge level
filled star empty star empty star

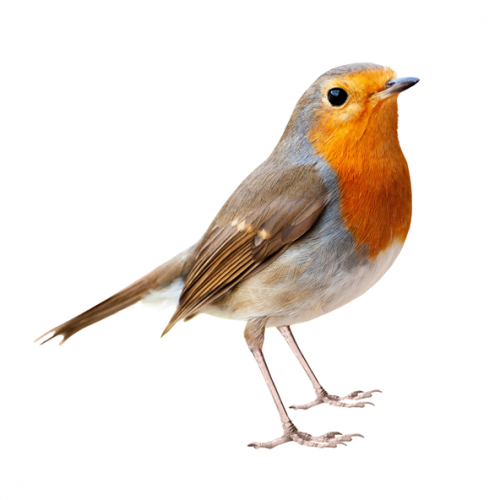
Have a look at this data from the RSPB 2011 Birdwatch. What can you say about the data?

How Big Are Classes 5, 6 and 7?
problem
Favourite

How Big Are Classes 5, 6 and 7?

Age
7 to 11
Challenge level
filled star empty star empty star

Use the two sets of data to find out how many children there are in Classes 5, 6 and 7.