If I Share, Will My Friends Share Too?
'Shared joy is a double joy' according to a Swedish proverb. Whether it's sharing your latest download or a bucket of popcorn at the cinema, sharing can bring joy. Sometimes it has the opposite effect, though. When someone falls ill with a highly infectious disease, we might assume that their close contacts can easily catch it too, perhaps by touching an infected surface or from inhaling infected air particles. One way to reduce the spread is by tracing the infectious person's contacts and asking them to isolate themselves for a short period of time. This method requires all contacts to isolate themselves, regardless of the type of interaction they had with the infected person, an approach which can become highly disruptive. Researchers in Cambridge wanted to investigate how different types of social contacts might predict the spread of disease. To do so, they needed two things: a branch of mathematics known as network theory and a group of teenagers willing to share their social networks.
Why teenagers?
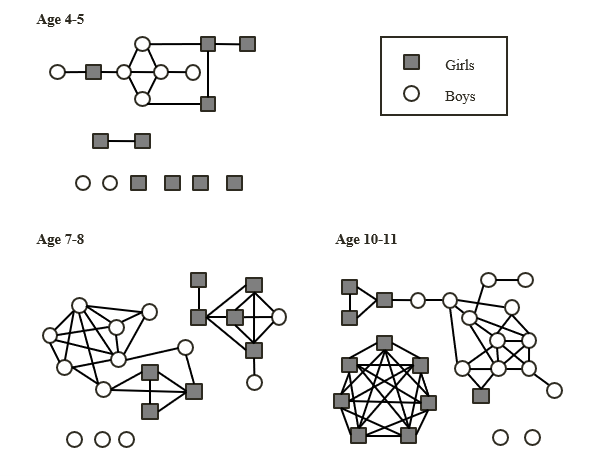
Many teenagers lead busy lives and their networks of social contacts are correspondingly large. Although younger children tend to have fewer contacts than teenagers, these network graphs illustrate just how quickly our range of social contacts increases as we grow older:

Self-reported social contacts of primary-aged school children (Source: Conlan et al., 2011)
By the time those primary-aged students transfer to secondary school, their self-reported social networks may have increased even further. The following network graphs illustrate the social networks of Year 7 students, recorded at four points between January and June, who attend a mixed secondary school (grey squares represent students self-reporting as female, white circles represent students self-reporting as male):

Self-reported social contacts of Year 7 students (Source: Kucharski et al., 2018).
The extensive social networks of many teenagers make them ideal subjects for researching how the spread of disease might be affected by different types of interactions and social contact, such as sharing a desk in a classroom, singing in a choir or going swimming.
The research project
Deliberately infecting teenagers with an infectious disease to monitor the spread of the disease amongst their social contacts would, of course, have posed huge ethical issues for the research team. The scientists adopted an innovative approach based on the huge numbers of bugs, bacteria and other microbes that already thrive on and within our bodies. A team of mathematicians led by Dr Andrew Conlan at the University of Cambridge investigated how staphylococcus aureus - a very common bacteria which lives harmlessly on the skin or in the noses of around 30%-50% of the population - spreads among the different social networks of teenagers.


Staphyloccocus aureus (Wikipedia https://commons.wikimedia.org/wiki/File:Staphylococcus_aureus_VISA_2.jpg)
Collecting the data
Local schools were invited to join this citizen science project. The researchers met teachers to outline the key teaching points of the project, which the schools built into their lessons. Permission was sought for consent from the parents and carers of the participating teenagers and their project data was anonymised.
During the year-long project the researchers visited the schools five times to train the students to collect data and help them analyse their own social network data. The teenagers were asked about their types of social interactions including whether they shared their drinks with their friends or if they were members of a club or sports team. The researchers also took samples from the students' noses using cotton wool swabs at various points throughout the school year. The nose swabs were tested for staphylococcus aureus.
Processing the huge data set
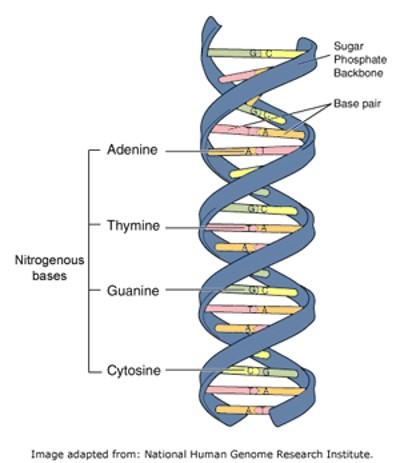
To understand how the different types of social contacts might influence who became a carrier of staphylococcus aureus, the anonymised social contact data collected from the students needed to be compared with the results of their swab tests. Each staphylococcus bacterium has its own unique copy of the genetic code necessary to grow and replicate itself. This code is written in the form of DNA molecules which consists of four base pairs (adenine, thymine, guanine and cytosine) - the DNA for a single staphylococcus aureus cell has 2.8 million base pairs!
DNA needs to be cut-up into fragments in order to sequence it (to determine the order of the four bases). DNA sequencers are scientific instruments which can read this code, but to do this quickly they make multiple copies of the DNA and cut them up into shorter, overlapping sequences called reads. The physical constraints of sequencing technology means that there is an incentive for using shorter reads - you can build a sequencing machine to read many short reads in parallel, in the same time that it would take to read a longer fragment. There is a trade-off in terms of the length of the reads – longer reads are more accurate but take much longer to sequence. The shorter the reads are, the faster you can sequence a whole genome, and the cheaper it becomes.
It turns out that the same branch of mathematics (network theory) used to analyse social networks can be used to help process the huge amount of data generated by sequencers and reconstruct whole genomes!

The sequencing machine labels the base pairs as A, G, C or T. Here's an extract from a genome sequence:

If we have overlapping sections for these reads then we can reconstruct what the original code was. This would be easy if sequencing machines could precisely cut-up any sample we give them. Unfortunately, they sacrifice speed for precision and effectively cut-up the sequences randomly into same-length samples. However, the more reads we collect – the more overlapping sequences we will be able to find. We can use computers – and network theory – to help sort through and logically reassemble this mass of data.
Here's an example of two reads taken from the longer sequence extract:

You'll notice that the two reads overlap one another, indicating that they may have been adjacent in the sequence. To reassemble the sequence, the computer builds a network where the edges are the overlaps (the number '6' refers to the number of overlaps). This is known as a directed network graph. Here's how the above two reads look on the directed graph:

This type of path, where we focus on building a path which connects each node, is known as a Hamiltonian path, named after Irish mathematician William Hamilton. Hamiltonian paths draw on the same mathematical ideas you might encounter investigating The Travelling Salesman style problems where you're challenged to find the most efficient route or path to visit several different locations. Finding an efficient path is a real-life problem faced everyday by delivery drivers, service providers (and researchers needing to process huge amounts of data).
We wanted to create an interactivity which replicated the process of reassembling the reads into a longer sequence. However, the human genome sequence is presented in base-4 since it only needs the four letters A, C, G and T and this results in extremely long sequences. To enable you to experience building your own paths, and limit the length of the sequences and reads you'll need to handle, we've changed the base of the activity. Humans have ten fingers, so we've developed an interactivity using our much more familiar base-10 system.
You can try reassembling a selection of reads to form a longer sequence using the interactivity below. You'll see a cog which allows you to reset it with different parameters. You can explore the effect of changing the sample length or allow the computer to introduce a transcription error in one of the reads - managing transcription errors is a challenge faced by real-life researchers. Some advice on using the interactivity is available here
As you can see, data collection can be a very difficult business. Since data can be missing or become corrupted, the rebuilding process needs to overcome these difficulties. For current sequencing technology our best solution is simply to generate more and more reads. Processing this data requires not just high performance computers, but cleverer and more efficient algorithms - for which fundamental parts of mathematics like network theory can help.
If I share, will my friends share too?
After reassembling the data and comparing their findings, the research team found that socially connected students were not more likely to have similar types of staphylococcus aureus. The number of students newly infected with staphylococcus aureus was found to be comparable to levels in the general community, and not higher, as expected. This was surprising to the researchers, but important to know as together it suggests that the spread of staphylococcus aureus occurs mostly outside the school gates, and that it spreads by different types of social contacts than those explored in this study.
The students also found some interesting results from their own study questions which they developed during the project. They found that those who shared their drinks were more likely to be friends with other teenagers who tended to share their drinks too. When we share a drink we may be sharing our germs. However, the impact of sharing drinks will be very different if pairs of people who share drinks are spread out through a school, or cluster together in cliques. When we have a group of individuals with a higher risk of transmission that cluster together – such as those who share drinks – we call it a "core group" in epidemiology. Core groups are important as once one member of the group is infected, they can lead to more rapid transmission than we’d expected on average – so called superspreading events. Core groups make control – and prediction – of epidemics much more difficult. Finding social traits that help structure human populations might in turn help us to better understand the likelihood of superspreading.
This was a really important result, as enabling high school students to design, carry out and analyse their own studies was a key objective for the project. This was also the first study to explore the spread of staphylococcus aureus in schools and its findings will provide a baseline for future studies to explore the spread of other infections using similar methods.
Dr Andrew Conlan would like to thank the schools, their students and families who supported this citizen science project. He would also like to thank his colleagues for their support throughout the project and The Evelyn Trust who funded this research study.
References
Conlan, A. J., Eames, K. T., Gage, J. A., von Kirchbach, J. C., Ross, J. V., Saenz, R. A., & Gog, J. R. (2011). Measuring social networks in British primary schools through scientific engagement. Proceedings of the Royal Society B: Biological Sciences, 278(1711), 1467-1475.
Kucharski, A. J., Wenham, C., Brownlee, P., Racon, L., Widmer, N., Eames, K. T., & Conlan, A. J. (2018). Structure and consistency of self-reported social contact networks in British secondary schools. PloS one, 13(7), e0200090.
