Brenchley and Matfield School sent in this excellently reasoned solution:
Arsenal and Manchester United played 15 games each.
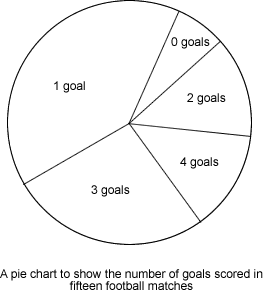
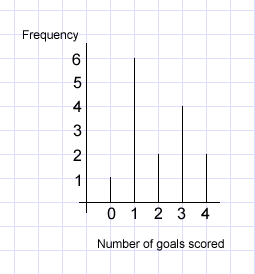
- The pie chart and the bar chart had the same amount of goals.
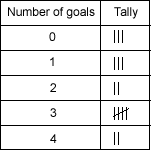
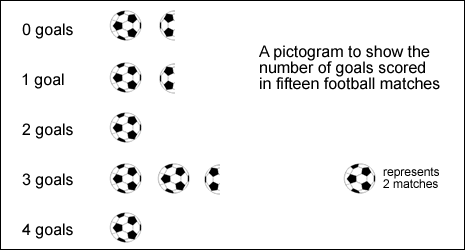
- The tally chart and the pictogram had the same amount of goals.
- I then did this to find the mean of the pictogram: 0x3=0 1x3=3 2x2=4 3x5=15 4x2=8 0+3+4+15+8 = 30 Divided by 15 =2.
- I then found the mode which is 3 because 3 goals was scored mostly
- Finally I found the median which is 2. 000111223333344
- The mode is 1 higher than the mean and the median is the same as the mean.
- This matches the data of the writing about Arsenal.
- This means the pictogram and the tally chart are Arsenal.
- This means the pie chart and the bar chart are Manchester United.
- Manchester United scored 30 goals.
George and Dominic from St Nicholas' C of E School, Newbury, also sent in a very clear solution:
We looked at the pictogram and worked out how many goals were scored altogether - that was 30.
We divided it by 15 (the number of games) to find the average or mean - that was 2.
The tally chart goes with the pictogram as both have a mode of 3 scored goals. These two are both Arsenal because Arsenal's mode of the number of goals scored (3) is one more than the mean number of goals scored (2).
On the frequency chart, the most goals scored was one. When we added all of them together (30) and divided it by 15, we got 2. This is the mean.
For Man U, the mean number is one more than the mode number so the mode is one. This means the frequency chart must be Man U.
The pie chart shows that one goal was scored the most often and that 0 goals was scored the least. These facts also apply to the frequency chart. So the pie chart is also Beta Rovers.
So the tally chart and the pictogram were Arsenal, and the pie chart and frequency chart were Man U.
Here are some more solutions.
We started by looking at the pie chart, the mode was 1 goal, which was the same as the bar line graph. We knew that the pictograph and the tally chart matched because the mode is 3 on both. The mean is 2 for all 4 graphs. Arsenal has its mode one more than the mean, so Arsenal has to be grouped with the tally chart and the pictograph. Therefore Man U has to be with the pie chart and the bar
line graph.
(Cirby, Isabella, George and Hannah, St Helen's C of E Primary School)
We started by ordering the numbers from the pictogram which were 0,0,0,1,1,1,2,2,3,3,3,3,3,4,4 and then calculated the median which was 2. We then calculated the mean which was 2. This was equal to the median which was one of the clues in the second box. We then used the chart to help calculate the mode by doing the reverse of the clue and adding 1 to 2 which was the mean and median.This
gave us our mode which matched up to the clue we then repeated the process to calculate the other mean, median and mode this gave us our answer. Arsenal's data was the pictogram and the tally. Man U's was the pie chart and bar chart.
(Patrick and James, Redlands Primary School)
The first thing we did was pair the cards that had the same number of goals. We paired the tally chart with the pictogram and the pie chart with the bar line graph. Then we found out the mode of both pairs by looking at the tally and finding the most tally marks. We also looked at the pie chart and noticed the largest section. After that we found the mean. We had to time the number of goals
by the number of times they came up, added the answers together and divided by 15 because they'd played 15 matches. We found the median by putting the numbers in order (eg for Arsenal it was 000111223333344) and finding the middle number. Finally, we read the description and found which team fitted it. Arsenal was the team that had scored 3 goals 5 times and Manchester United was the team that
had scored 1 goal 6 times.
(Grace and Katie, Greenacre School for Girls)


