

How Big Are Classes 5, 6 and 7?

 1 out of 3
Use the two sets of data to find out how many children there are in Classes 5, 6 and 7.
Problem
How Big Are Classes 5, 6 and 7? printable sheet
Four pupils from Class 4, Ben, Ali, Katie and Charlene, decided to make graphs of the sizes of the seven classes in the school.
Ben and Ali found out how many children there were in Classes 1, 2 and 3.
Katie and Charlene found about Classes 5, 6 and 7.
Of course they all knew the number of children in Class 4.
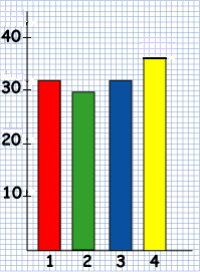
Ben and Ali drew a bar chart. It looked like this:
Katie and Charlene drew this pictogram:
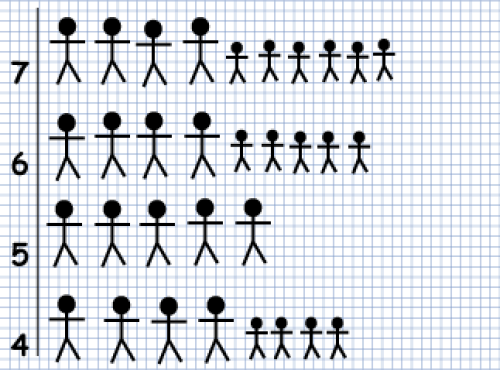
Kate and Charlene have forgotten to add a key to their pictogram. What should the key say?
How many children were there altogether in Classes 5, 6 and 7?
Getting Started
You can work out the number that each pin-man stands for from the two graphs for Class $4$.
Student Solutions
Mikey from Archibishop of York C of E Junior School thought hard about this problem. He says:
Using the bar graph for class 4 gives 36 pupils but this allows several possible answers:
$5\times4 + 4\times4 = 36$ but so does
$6\times4 + 3\times4$,
$7\times4 + 2\times4$,
$8\times4 + 1\times4$.
All these are the same as 9$\times$4. We know big plus small must equal 9 but not the split from the info given. Maybe if Katie and Charlene had done classes 1 to 3 as well we would have been able to work it out.
Well done, Mikey for seeing that there are several possible solutions - not many of you realised this. What answers are possible then? Might some be more likely than others do you think?
Lizzi from Bampton C of E Primary School wrote:
By looking at the amount of pupils in class 4 on the bar graph, you can tell that the big people on the graph equal 6 and the little people equal 3 people, so therefore there are 42 people in class 7, 39 people in class 6 and 30 people in class 5 which equals 111 pupils.
This is certainly one of the possibilities. Freddie from Whitehall Primary School calculated another one:
Big people = 7
Small people = 2
Year 5 = 35 Year 6 = 38 Year 7 = 40
Total = 113
Joshua from BMGS suggests:
... for each big figure it was 8 and for each small one it was 1. Then it was a simple solution of adding up all of years 5, 6 and 7. The total answer was 115.
James, a teacher at Christchurch Purley C of E Primary School wrote to say:
The class really enjoyed getting stuck into the problems and discovering the different solutions.
I was really impressed with two of my children who I asked to find more solutions once they had found one. They thought of the large stickmen representing 10 and the small stickmen representing -1. I understand that this is not normally how pictograms would work but I thought it was fantastic 'out of the box' thinking and a great way to find more solutions to the problem. After this they thought of the stickmen representing 11 and -2.
Another pair of children claimed the solutions they had found had the pairs of stickmen always adding to 9. We were then able to back this up as a class with the solutions involving negative numbers that also equalled 9.
Thank you for sharing this, James, and well done to the class!
We are still left without the solution for a big stickman representing 5 children and a small stickman representing 4 children, but thank you for all your contributions.
Teachers' Resources
Using NRICH Tasks Richly describes ways in which teachers and learners can work with NRICH tasks in the classroom.
Why do this problem?
This problem encourages learners to contrast different ways of representing similar data, and helps to make explicit their interpretation of what the data represents in order to solve the problem. The task will also help children to realise the significance of labels on charts.
Possible approach
Tell the story of the problem orally, revealing the two representations on the board. Rather than asking the questions straight away, you could invite the class to look at the two charts and consider what they notice, and what they wonder, perhaps in pairs.
You may find that when you bring everyone together again, some learners point out that the key is missing on the pictogram and so once other contributions have been made, you can focus on this part of the challenge.
Give out copies of this sheet, which is a copy of the problem, and invite pairs to work on the task.
In the final plenary, you could discuss not only the answers to the problem itself, and how these were reached, but also stress why it is important not to leave out the labels on axes of a graph!
Key questions
What is a reasonable number to try?
What can you find out about Class 4 from the bar graph?
Can you work out the number that each figure stands for from the two graphs for Class 4?
Possible extension
Learners could make different graphs and representations of the numbers in the classes in their own school.
Possible support
Learners might like to try the task The Pet Graph first, which is more straightforward.