Journey to School
How risky is your journey to school?
Problem
This resource is part of the collection Should I Risk It?
This problem invites you to consider some graphs showing data about the risk involved in travelling to school.
Before reading on, have a think about how risky you think travelling to and from school might be. How likely is it that you might be involved in a road accident?
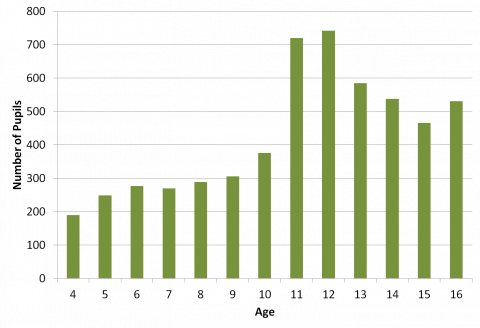
Graph of the numbers of pupils on the way to or from school involved in road accidents in 2014
Image

What are the key features of the graph?
Can you think of reasons why the graph might have the shape it does?
There are approximately 750,000 pupils in each year group.
How do these statistics affect your perception of the risk of travelling to school?
Graph of the numbers of pupils on the way to or from school involved in road accidents in 2014 by gender
Image

How do the graphs for boys and girls compare?
Can you think of any explanations for what you've observed?
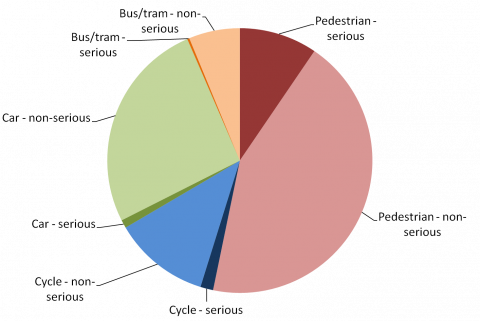
Graph of the numbers of pupils on the way to or from school involved in road accidents in 2014 by mode of transport
Image

What does this graph suggest are the most and least safe modes of transport?
What other information might you want to know in order to make an informed decision about the safety of different modes of transport?
Click below to see some potentially useful information.
What other information might you want to know in order to make an informed decision about the safety of different modes of transport?
Click below to see some potentially useful information.
The table below shows the percentage of pupils who travel to school by different modes of transport.
| Mode of Transport | Percentage Use |
| Walking | 42% |
| Cycling | 2% |
| Car | 35% |
| Bus/tram | 21% |
How does this information affect which mode of transport you would regard as the highest risk?
What other factors might there be that affect how much risk is assosciated with the different modes of transport?
Why might people choose to use modes of transport even though they are more risky?
Understanding Uncertainty, Professor Spiegelhalter's website, has lots of articles about probability and risk that you might find interesting. There are some suggestions below, but there's lots more you can explore.
Getting Started
Is your journey to school the same now as it was when you were younger?
Does each mode of transport have the same number of people using it?
Does everyone's journey take the same length of time?
Does everyone travel the same distance?
Does each mode of transport have the same number of people using it?
Does everyone's journey take the same length of time?
Does everyone travel the same distance?
Student Solutions
Thank you and well done to everyone who submitted solutions to this problem, there were some really good solutions.
Brendon, from St Mary's Catholic High School, noticed which ages of children are most likely to be involved in a road accident:
That most people that have road accidents are around the age of 11 and 12, meaning they are less responsible than others on the road as over 700 kids of this age are at risk.
Hazel, from Kings Norton Girls' School was able to offer an explanation of why this might be the case:
Key features ofthe first graph are that the youngest people in secondary schools are involved in road accidents the most (between the ages of 11 and 12). This is most likely because they will be walking or taking the bus by themselves in most situations without a parent to watch over them.
Rhiannon explored a different feature:
The number of pupils involved in road accidents increases through primary school, and then increases greatly at the ages of 11 and 12, when pupils go to secondary school. The number then decreases for older secondary school pupils.
This could be due to parents being much more restrictive with their children when they are younger, such as holding their hand, but older children are likely to have more freedom when they travel to school.
Many pupils start travelling to school without their parents when they begin secondary school, which might mean that they take more risks. They might also be travelling further than they did to go to primary school.
Secondary school pupils might be less likely to be involved in accidents when they are older as they are more likely to be more responsible.
Brendon was able to put the graph into context:
The people who are 11 and 12 (Y7-8) are 720/750,000 which means 3 out of 3125 aged 11 or 12 was involved in a road accident.
The people who are 4 and 5 (F2-Y1) are 250/750,000 which means 1 out of 3000 aged 4 or 5 was included in a road accident.
Rhiannon went on to describe what these values meant to her:
The rate of accidents varied from about 190 for four-year-olds to 730 for 12-year-olds. Since there are 750,000 students in each year group, this means that less than 0.1% of students are involved in accidents. This means that they are rare, but you should still be careful when travelling to school.
Hazel compared the rates of accidents amongst girls and boys:
Boys are hit around 25% to 35% more than girls. I think this is because they tend to have things such as footballs on them that are chased after into roads.
She was also able to compare the different modes of transport.
Cycling is the safest way of transport and walking is the least. It would help to know the percentage of use for each of the transport and how often things such as cars and busses break down.
Rhiannon also compared the different modes of transport:
Looking at the pie chart, it seems that walking is the most dangerous way to get to school, because it has the highest proportion of accidents, and that travelling by bus or tram is the safest, as it had the lowest percentage of accidents.
However, it would be useful to know how popular each mode of transport is, as this would tell us which is more risky for an individual person. To work out the relative risk of the different modes of transport, the proportion of accidents that occur can be divided by the proportion of people who use that mode of transport.
This gives:
| Mode of Transport | Calculation | Relative Risk |
|---|---|---|
| Pedestrian | $\frac{190}{360} \div 0.42$ | 1.26 |
| Cycle | $\frac{50}{360} \div 0.02$ | 6.94 |
| Car | $\frac{95}{360} \div 0.35$ | 0.75 |
| Bus/Tram | $\frac{25}{360} \div 0.21$ | 0.33 |
This implies that cycling is the most risky method of travelling to school, as there is the greatest risk relative to the average.
However, the length of the journeys may be different - more people are likely to walk when the journey is shorter, and use other modes of transport when their journey is longer. The people using the different modes of transport may be of different ages, which will also affect the risks involved.
Some people might want to cycle or walk because it will give them exercise and make them healthier. Other people might not own a car, and there might not be a bus or tram route that takes them near to the school. Also, some people might want to walk or cycle because it doesn't release carbon dioxide from the vehicle, so is better for the environment.
Hazel also offered some explanations for why these might vary, and why people might use different modes of transport.
People might be more likely to cause road accidents if it is foggy or rainy or someone is drunk driving. A certain transportation may be used as it is quicker to get somewhere using it or is the only means of transport you are willing to use as bus fares can be expensive.
Thank you to everyone who submitted solutions to this problem, and well done!
