You Never Get a Six
Charlie thinks that a six comes up less often than the other numbers on the dice. Have a look at the results of the test his class did to see if he was right.
Problem
It was raining and Tom, Vincent, Charlie and Edward had been playing a game with dice during break.
"You never get a six when you want one," grumbled Charlie, "I'm sure sixes come up less than the other numbers!"

Miss Brown heard him.
"You can all try throwing dice and noting what you get," she said, "It fits in quite well with the work we are going to do next. Throw the dice and make a list of what you get. See if you get fewer sixes then."
"Sixes only come up less when it really matters," grumbled Charlie.
Miss Brown thought for a moment.
"I'll give a Team Point to the one who gets the most sixes," she said, "Mind you, no cheating!"
"Wow!" exclaimed Vincent.
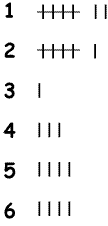
The children all threw the dice the same number of times and made lists of their throws. Here is Edward's list for his throws:

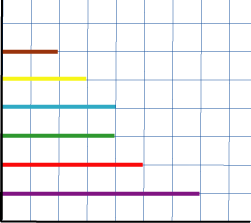
They decided to keep the colours they used to represent each number the same when they recorded their work so they could compare them easily.
Here is the graph Edward made from his figures:

Here is Charlie's unfinished graph (he hasn't labelled anything yet):

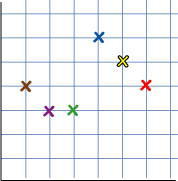
Here is Tom's unfinished graph:

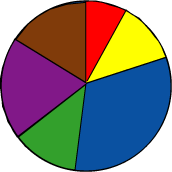
Here is Vincent's unfinished pie-chart:

Who won the Team Point for the most sixes?
How many 1s, 2s, 3s, 4s, 5s and 6s were thrown altogether?
What percentage (how many out of 100) of the throws were sixes?
Getting Started
Remember that all the boys threw the dice $25$ times and that the colours of the numbers remain the same for all diagrams.
The 25 throws are represented by 360 degrees on the pie chart. How many degrees will be needed to represent each throw?
Student Solutions
Lisa from Haberdashers Askes School for Girls answered the questions:
Charlie threw the most 6's.
15 6's were rolled,
15 5's were rolled,
21 4's were rolled,
11 3's were rolled,
21 2's were rolled,
17 1's were rolled.
15% of the100 throws were 6's
Thank you also to Akalya, Vanessa and Kirsty from Devonshire Primary School who sent in a clear solution to this problem.
Teachers' Resources
Why do this problem?
Possible approach
Key questions
Possible extension
Learners could make graphical representations of their own dice throws or do How Big Are Classes 5, 6 and 7?
Possible support
Suggest trying The Pet Graph first which is simpler and easier to understand.
