

Now and Then

 2 out of 3
Have a look at these past sporting results. Can you use them to predict future results?
Problem
In 1908 the Olympic Games were held in London. They were held in London again in 1948, just after World War 2.
Here are the results from some men's track events:
1908
100 metres 10.8 seconds
200 metres 22.6 seconds
400 metres 50.0 seconds
800 metres 112 seconds
1500 metres 240 seconds
1948
100 metres 10.3 seconds
200 metres 21.1 seconds
400 metres 46.2 seconds
800 metres 109 seconds
1500 metres 229 seconds
The 2012 London Olympics were another 64 years later. Here are the men's track results:
2012
100 metres 9.6 seconds
200 metres 19.3 seconds
400 metres 43.9 seconds
800 metres 101 seconds
1500 metres 214 seconds
How did the results differ?
Could you have predicted the 2012 results?
Perhaps more importantly, what's the reason for your answer?
Here are the women's swimming results from the 1948 Olympic Games and the 2012 Olympic Games:
1948
100 metres freestyle 66.3 seconds
400 metres freestyle 318 seconds
100 metres backstroke 74.4 seconds
200 metres backstroke 177 seconds
2012
100 metres freestyle 53 seconds
400 metres freestyle 241 seconds
100 metres backstroke 58.3 seconds
200 metres backstroke 124 seconds
How did these results differ?
Could you have predicted the results?
Can you use these results to predict what the women's swimming results will be in the next Olympic Games?
How accurate do you think your prediction is?
Getting Started
How far is 100m? 200m?...
Can you imagine or measure this distance?
How long would it take you to run this distance?
How far could you run in 10 sec, 20 sec?
Student Solutions
Max and Charlie from Corpus Christi School in Australia sent in the following predictions for 2016 and now that the Games are over I've added in the actual results alongside Max and Charlie's:
100m -> 9.5s Actual was 9.81s
200m -> 18.7s Actual was 19.78s
400m -> 40.12s Actual was 43.03s
800m -> 104.2s Actual was 102.15s
1500m -> 211.4s Actual was 230s
Thuong from ISM school sent in the following:
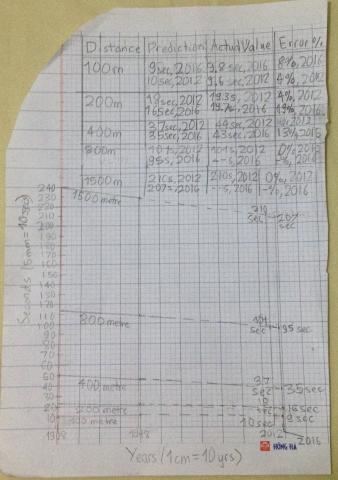
It came to me that the seconds taken should decrease with the years, so I decided to draw a line graph and draw a line between the values of 1908 and 1948. Then, I drew the line and stopped it when it was directly above the year I wanted (either 2012 or 2016). After doing this, I would be able to see my prediction. I knew that my prediction wouldn't be exact, but in this way, I could estimate where the values would be around. I then looked at the actual values and calculated the error percentage. With this data, I made a chart to display all of the info I had.
About the results:
I think that my predictions were pretty accurate, but I wonder why the 400m prediction's error percentage is so much higher than the others' error percentages. I believe that it's in between sprinting of 100m and skill running of 1500m. I also saw that most of the slopes of the distances are around the same amount. Even though we do not have the final results for 1500m and 800m yet, based on other predictions I will expect them to be pretty close to my predictions. Another observation is that even though the times taken in general decrease over the years, the scores of the next Olympics are not necessarily always better than of the previous ones.
Where to find what:
The graph I used is located on the bottom. I stuck to the men's side of athletics. On the top is a chart that displays the length of the course, the predicted value for both 2012 and 2016, the actual value of the scores for both years, and the error percentage.
Thank you Thuong for you explanations, keep up the good work.
Teachers' Resources
Using NRICH Tasks Richly describes ways in which teachers and learners can work with NRICH tasks in the classroom.
Why do this problem?
This activity gives an opportunity for pupils to examine data and then consider all different kinds of influencing factors in order to predict what will happen another 64 years on. It can offer a good forum for debate and discussion while sharing views about things that will affect the results. It may help some children to understand that any answer can be deemed 'correct' so long as it can be justified.
Possible approach
For many classrooms it would be best to give the results of one event to each group of pupils. They will obviously need opportunities to work as a group and come up with an agreed result. When these results are shared towards the end of the session, there could be some further discussions about the results for one year. This could involve looking at the relationships between the timings for different distances.
Key questions
What do you think is important about deciding the times for that race?
Tell me about your ideas.
Do the whole group agree? If not, why?
Possible extension
Ask questions such as:
What do you think about these results getting better and better as time goes on?
What about the results in another 100 years time?
This should give the opportunity for some good creative thoughts to be shared.
Results from other years could also be examined to see whether results steadily improve or whether there are any sudden changes in the patterns. What might be the reasons for this? Children who are beginning to understand what graphs can mean may like to take a look at those in the activity Olympic Records.
Possible support
Some pupils may need help in making sense of the results. They could look at the distances on the sports field to get a real idea of what the distances are like.
It may also be helpful to see what they can do in periods of 10 secs, 21 secs, and 22 secs so that they understand just how quickly these races are being run.