Normal Intersection
In what ways can the pdfs of two normal distributions intersect?
Problem
The probability density functions for two normal distributions are plotted on the same axes.
How many times can the two curves intersect? You might wish to start off using diagrams to aid your intuition, but be sure to justify your answers using reasoning from probability and algebra.
Did you know ... ?
Whilst diagrams are very useful tools at all levels of mathematics, 'diagrammatic fallacies', where incorrect properties of a mathematical object are intuited from a picture, are also common. When using a diagram in mathematics care always needs to be taken that these fallicies are avoided.
Whilst diagrams are very useful tools at all levels of mathematics, 'diagrammatic fallacies', where incorrect properties of a mathematical object are intuited from a picture, are also common. When using a diagram in mathematics care always needs to be taken that these fallicies are avoided.
Student Solutions
(This is a solution using the properties of distributions. A
shorter solution exists with the use of logarithms)
To begin solving this problem I sketched out some possible curve-intersection scenarios based on the assumption that a normal distribution curve looks 'bell-shaped'. I remember that any normal distribution is exactly characterised by its mean $\mu$ and standard deviation $\sigma$ and the probability density function in this case is
$$
f(x) = \frac{1}{\sqrt{2\pi\sigma^2}}e^{-\frac{(x-\mu)^2}{2\sigma^2}}
$$
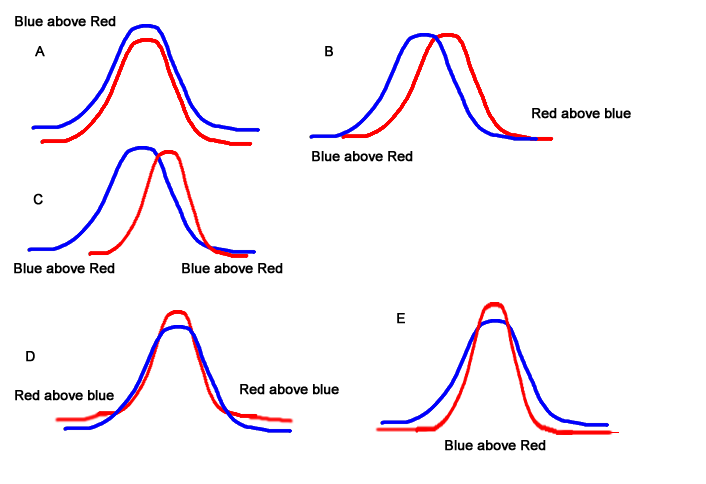
I thought of these plausible cases, where I have indicated the asymptotic behaviour of the two curves, from which I could start a more careful analysis:

This is a problem which will benefit from a 'case-by-case' analysis.
For zero intersections (case A) one of the density functions must be below the other at all points. Since the integrals (areas beneath the curves) of the density functions must equal $1$ this is impossible. Thus, the two density functions must intersect at least once: zero intersections is impossible.
For case B there is one intersection. To prove that this is the case imagine starting with two $N(0,1)$ distributions and increasing the mean of one of them slightly: this translates the curve to the right a little. Since any normal density function decreases with distance from the mean we can deduce that the form of our picture is correct, so 1 intersection is possible.
The sliding argument used previously might work for case C. Let's see. We'd need to change the standard deviation of one of the distributions. As I reduce the standard deviation of the red curve it would get more spiked, but both of the tails are flattened (you can see this by looking at the distribution function). For example, for large enough $x$ we have:
$$
N(0,1)\sim \frac{1}{\sqrt{2\pi}}e^{-\frac{x^2}{2}}> \frac{1}{\sqrt{2\pi\times 10}}e^{-\frac{(x-1)^2}{2\times 10}}\sim N(1, 10)
$$
whereas for $x=1$ we have
$$
\frac{1}{\sqrt{2\pi}}e^{-\frac{x^2}{2}}< \frac{1}{\sqrt{2\pi\times 10}}e^{-\frac{(x-1)^2}{2\times 10}}
$$
Thus, C is possible. Case E is very similar. Thus, two intersections are possible.
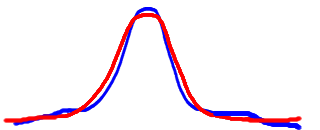
For the red curve of case $D$ to peak above the blue curve we would need the red curve to have a smaller standard deviation; however, this means that the tails would have to be below those of the blue curve; thus case D is impossible. However, this does not rule out rather improbable cases such as

So, what is it about this configuration which makes it impossible (which I feel that it is)? Well, the gradient of one of the blue curve would need to increase and decrease. This would mean that we would need more than two points of inflection; a quick differentiation shows that this is impossible.
Thus, $2$ is the maximum number of intersections.
To begin solving this problem I sketched out some possible curve-intersection scenarios based on the assumption that a normal distribution curve looks 'bell-shaped'. I remember that any normal distribution is exactly characterised by its mean $\mu$ and standard deviation $\sigma$ and the probability density function in this case is
$$
f(x) = \frac{1}{\sqrt{2\pi\sigma^2}}e^{-\frac{(x-\mu)^2}{2\sigma^2}}
$$
I thought of these plausible cases, where I have indicated the asymptotic behaviour of the two curves, from which I could start a more careful analysis:
Image

This is a problem which will benefit from a 'case-by-case' analysis.
For zero intersections (case A) one of the density functions must be below the other at all points. Since the integrals (areas beneath the curves) of the density functions must equal $1$ this is impossible. Thus, the two density functions must intersect at least once: zero intersections is impossible.
For case B there is one intersection. To prove that this is the case imagine starting with two $N(0,1)$ distributions and increasing the mean of one of them slightly: this translates the curve to the right a little. Since any normal density function decreases with distance from the mean we can deduce that the form of our picture is correct, so 1 intersection is possible.
The sliding argument used previously might work for case C. Let's see. We'd need to change the standard deviation of one of the distributions. As I reduce the standard deviation of the red curve it would get more spiked, but both of the tails are flattened (you can see this by looking at the distribution function). For example, for large enough $x$ we have:
$$
N(0,1)\sim \frac{1}{\sqrt{2\pi}}e^{-\frac{x^2}{2}}> \frac{1}{\sqrt{2\pi\times 10}}e^{-\frac{(x-1)^2}{2\times 10}}\sim N(1, 10)
$$
whereas for $x=1$ we have
$$
\frac{1}{\sqrt{2\pi}}e^{-\frac{x^2}{2}}< \frac{1}{\sqrt{2\pi\times 10}}e^{-\frac{(x-1)^2}{2\times 10}}
$$
Thus, C is possible. Case E is very similar. Thus, two intersections are possible.
For the red curve of case $D$ to peak above the blue curve we would need the red curve to have a smaller standard deviation; however, this means that the tails would have to be below those of the blue curve; thus case D is impossible. However, this does not rule out rather improbable cases such as
Image

So, what is it about this configuration which makes it impossible (which I feel that it is)? Well, the gradient of one of the blue curve would need to increase and decrease. This would mean that we would need more than two points of inflection; a quick differentiation shows that this is impossible.
Thus, $2$ is the maximum number of intersections.
