Where Art and Maths Combine
I'm a bit of a "late bloomer", having "hit the Maths Wall" just after "O" level. It took a very enthusiastic teacher to reawaken my early love for the subject and, as with many converts, I've been thoroughly smitten with the love of maths I had when very young. As I am also doing an art degree, for fun, I wondered what would happen when you mix the two.
Plenty of artists and mathematicians have mixed both subjects; most notable of these being, of course, Leonard da Vinci. Choosing one topic, perspective, I constructed a timeline to see how much cross-over there actually was. Apparently, many early artists were mathematicians and/or scientists. More than a few were also architects.
Having drawn a spider diagram to organise my thoughts, there were so many areas I could explore, but didn't have the time. It was time to narrow down the field of enquiry. One area of mathematics stood out for me - fractals. Ever since I saw my first computer-created fractal image I have been fascinated by their beauty. The question was how I could create my own, original work.
Looking first at the original Mandelbrot equations, I tried to calculate variables to make a Mandelbrot plot. This is not easy maths! At one glance it is obvious to see why fractals didn't really come into their own until computers grew up a bit. I lost and found and lost myself again in the complicated calculations. As my programming skills only reach to BASIC, and I didn't have Visual Basic up and running on my computer, I thought there had to be a more artistic solution.
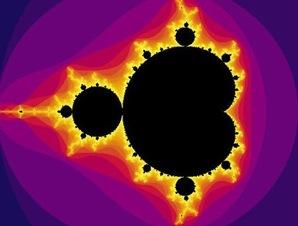
Here is a traditional Mandlebrot fractal. It has a very distinctive appearance and shape, which is reiterated (repeated) in varying sizes, throughout. If you zoom in on any fractal, you see the same level of detail and complexity as you do with the original image.
There are a number of fractals that may be hand drawn, the first of these being the Cauliflower.
Another fractal which can be drawn is the Van Koch Snowflake. Here are a few images of my early attempts.
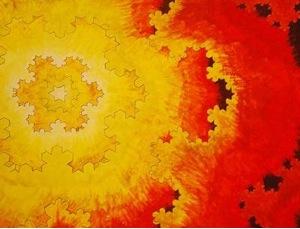
If you would like to explore the Snowflake to create you own images then this previous challenge shows you how the Snowflake begins. It gives you step-by-step instructions to create your own Van Koch Snowflake. It would be a good idea to look at this before proceeding further.
This further challenge uses the program LOGO to draw similar fractals. You would need access to that program to be able to complete the challenge.
My tutor challenged me to create my own, original fractals, using IT-based methods, rather than paint and brush. I suppose I'm a bit old-fashioned, but it was quite difficult to accept that digital art is as valid a medium as using acrylics and a brush! Finding the right software that would enable me to do this was the next step. There are a number of programs, other than LOGO, out there. Some are simply Mandelbrot viewers, which enable you to zoom in on portions of the Mandelbrot set. You can choose the area to look at and even change the colour of the image. However, there is little or no real mathematical calculation involved. These can give you some interesting images, but they are hardly original. The limitation of this particular program is that it only works to about six levels of magnifications, then degrades into a series of colourful parallel lines. Still, the results are quite aesthetically pleasing.
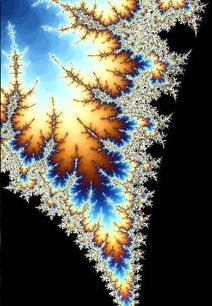
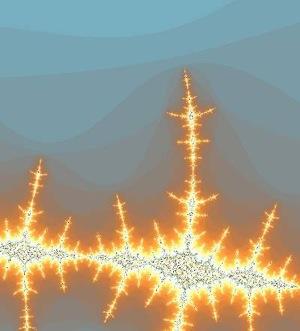
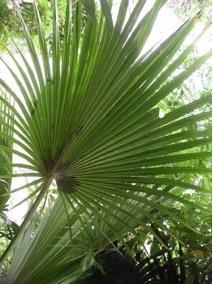
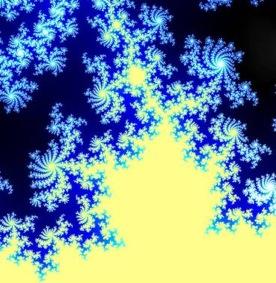
Further manipulation of such images, using a program such as Paint.net, can improve the interest of the image. Photographs can also be 'fractalised' in this way. Paint.net has a tool bar which allows manipulation of fractal images. This has a 'render as fractal' facility, which takes a regular picture and creates a Julia or Mandelbrot fractal from the digital information stored within the photo.
However, in the images below I have used sections from fractals cropped from the Mandelbrot viewer program.
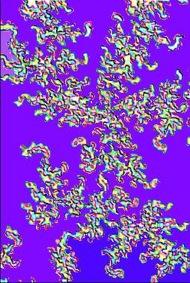
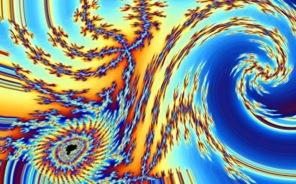
The image on the left has been 'embossed' and has 'show outline' added. The image on the right has had a portion of the image 'twisted'. This facility has provision for you to input the degree of rotation. The images below these show how a photo can be rendered into a Mandelbrot fractal.
Image
| Image
|
| Using 'Relief' | Adding a twist to a Mandelbrot |
Image
| Image
|
| A Palm at Kew Gardens | ... given the Mandelbrot treatment |
The Mandelbrot Generator used in the first four images can be found at the following web address:
http://www.scribd.com/doc/2826497/Math-and-Art-by-audre-WeirdArtscom
For a more in-depth, technical look at how Fractals can become artwork, there is a great step-by-step tutorial by Damien Jones, at the following address:
www.fractalus.com/info/step-by-step.htm
My next stage involved finding software with which I could interact and input my own variables. If you would like to try this program, it's free for a month, if you can put up with the watermark across your images. I cropped around it, before I decided that I had to have the real thing. The website is:
www.fractalsciencekit.com
The fractals all start from the basic Mandelbrot, Julia or Orbit Trap equations. These are already in place. From that point, you have a huge variety of variables you may manipulate, from basic issues such as enlarging or adjusting the centre point, to adding transformations, such as rotation or shear. This link takes you to several examples, showing you the screenshots of the mathematical equations and how you can adjust them.
Here are a few examples of the fractals I have been growing with it. The first two were made using the trial version.
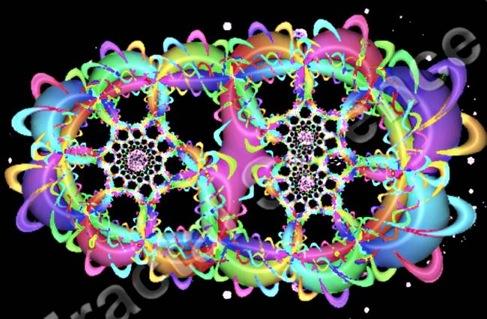
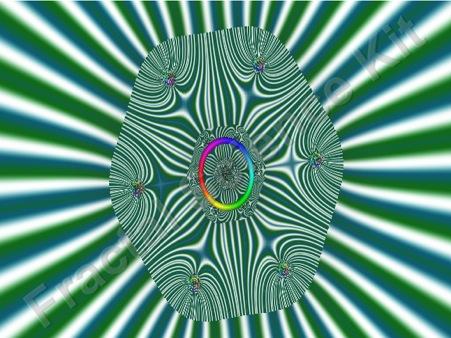
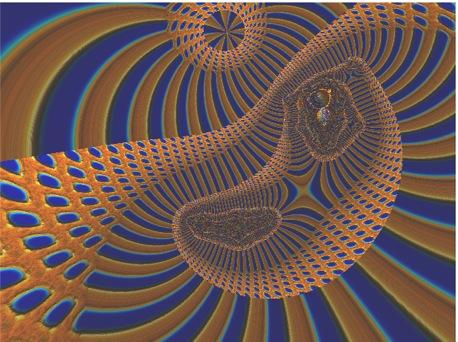
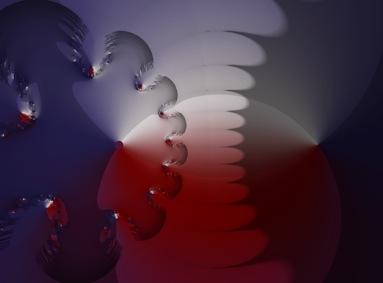
These were generated once I bought the program. Their complexity comes from growing familiarity with what changes can be made to equations.
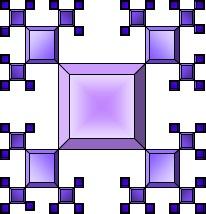
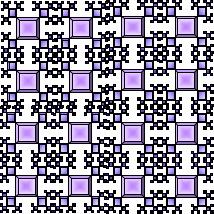
My current challenge is to make a Mathematical model of a fractal. Working initially on a SMART board, I created a pattern, which I repeated to form the surface of the blocks from which I would build the fractal model, but also to form the template of how the blocks would join together. It is very much still a work-in-progress. My formula is Zn = Zo/2. The variable 'Z' refers to the dimensions of the cubes; 'n' means 'new' and 'o' means 'old'. So the formula reads: The dimensions of the new level of cubes are half the dimensions of the previous level.
Image
| Image
|
| This is the initial design | This is the cover for one face of each cube |
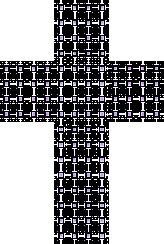
This handily copied to form a net to wrap around a cube. This led to the mass construction of far more cubes than I had anticipated.
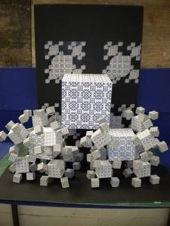
Take one corner, for instance: it contains one $12$cm$^3$, seven $6$cm$^3$ and forty-nine $3$cm$^3$.
Challenge:
Given that there are four corners at the front of the model; can you work out how many cubes are needed to complete the top two corners?
I also intend to add three projecting corners from the four $6$cm$^3$ digitally produced on the background. These will consist only of the $6$cm$^3$ and the $3$cm$^3$ cubes. That being the case; how many cubes would I need in total, in order to complete the model?
Finally:
I hope that maybe some of you reading this will start to be inspired to venture further in your own directions. It has been a wonderful journey for me, using my particular interests and skills. Whatever your interests and skills are there may be a place for them in this area of Mathematics and Art. It may simply open a new door for you that you did not know existed. Enjoy.
