What Does It Say to You?
A "representation", at its simplest level, is defined in the Oxford Dictionary as "a thing that represents another". Springing from a course I attended where we looked at mathematical representation, here I look at an example discussed during the course and consider the difficulties I had in understanding it. Finally, I will look at children's use of representations in the reception classroom, both spontaneous and teacher suggested.
Graphs as a representation
I am comfortable with plotting graphs and enjoy thinking
through how I might represent information graphically. The first
example relates to buying Pritt sticks, where the price for each
stick gradually reduces as you purchase larger quantities. When
plotting the graph I had to ask myself questions such as, "Do I
need to join the points I have plotted for the number of Pritt
Sticks I can buy against the cost?" "What do joined points
represent?" "Does this have any meaning in this case since I am
unable to buy half a Pritt Stick?" etc. (see table 1 and figure
1).
|
Image
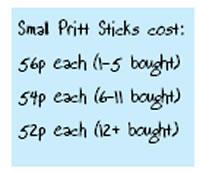
table 1
|
Image
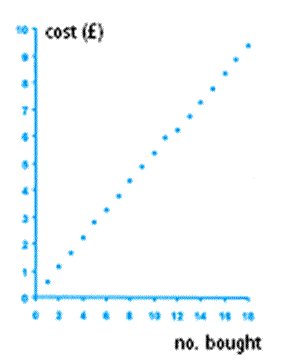
figure 1
|
The graph of number bought (x-axis) against cost (y-axis)
would therefore look something like figure 1. On the course I was
also introduced to step functions for the first time (as far as I
can remember, anyway!). These proved to be a very useful and
logical way to represent cases where, for example, the number of
footballs that can be bought at £6.50 is plotted against
how much is available to spend (up to £100). This form
of representation allowed for the fact that whether you had
£19.50 or £25.99, you could still only buy 3
footballs but as soon as you had £26.00, you were able
to purchase 4 footballs. The open dot represents the point at which
the step to the next amount is made (see figure 2).
Image
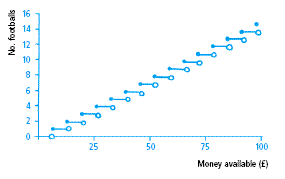
figure 2
This representation proved very powerful at representing several sets of data e.g. how many buns I can buy with a given amount of money, or the cost of sending different weights of packages by first and second-class mail.
I also enjoyed attempting to sketch graphs from pictures. For example, being given a racing circuit and plotting the speed of the car against its distance along the track (see figure 3). I found the task of sketching the graph from the circuit fairly straightforward, although it was more of a challenge to sketch the circuit from the "speed versus distance along the track" graph! (See figure 4.) I had to consciously remind myself of what the axes represented and not dwell on what the pictorial drawing could represent; for example, the bends in the graphs did not necessarily represent bends in the track!
|
Image
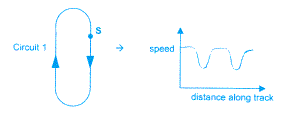
figure 3
|
Image

figure 4
|
Pimm (1995) speaks of the iconic images that graphs can provide. He states:
"Since all
graphs have some symbolic features, their meanings are not
transparent but need to be "read". Graphs are the drawn result of
an action, a process." [1]
It was the reading of the graph that I found challenging. A
study by Janvier in 1981 illustrates children having very similar
difficulties [2]. Only 46% of 12 - 13-year-olds, when asked how
many bends there were on the circuit (looking at a similar graph to
that in figure 4), gave the answer of three, and only 68% of 14 -
15-year-olds gave the correct answer. At least I was not alone!
Another example of moving from a real experience to a graphical
representation is given by constructing a graph to show the
height-volume relationship for beakers as they are steadily filled
with liquid. For example, if container A is steadily filled with
water, the height-volume relationship is represented by the graph
in figure 5.
Image
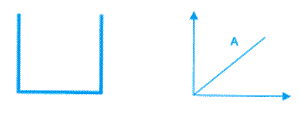
figure 5
I found it relatively straightforward to relate the two images. I could understand the relationship between the fact that the container had straight sides and how that would lead to the height of the water increasing at a constant rate compared to the volume of water that had been added i.e. the graph required a constant positive gradient. However, my understanding was challenged when I moved from a more complex height-volume graph to a sketch of the container. The height/volume graph is shown in figure 6.
Image
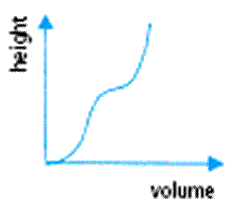
figure 6
I initially concluded that the container would have the form shown in figure 7, since the rate at which the height was increasing initially with volume was increasing ie, the container got narrower, and then it decreased ie, the container must now get wider. Then, finally, the gradient began to increase again ie, the container got narrower again.
Image

figure 7
However, when we discussed this, two alternative suggestions were made, shown in figure 8.
Image
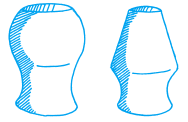
figure 8
Both of these sketches also appeared to be described by the graph in figure 6. They each showed the container initially getting narrower, then wider and finally narrower again, yet they were clearly not the same as each other. These three possible solutions caused each of us to attempt to justify our own representation. Although we did not draw a final conclusion as to which was correct, this debate ensured each of us had thoroughly engaged with each other's representations. The representations in figures 6, 7 and 8 are examples of what Janvier, Girardon and Morand would describe as "external" and "internal" representations:
"External
representations act as stimuli on the senses and include charts,
tables, graphs, diagrams, models, computer graphics, and formal
symbol systems. They are often regarded as embodiments of ideas or
concepts. The nature of internal representations is more illusive .
. . They are regarded as cognitive or mental models. They are also
referred to as schemas, concepts, conceptions, and mental objects."
[2]
Thus, in this case, figure 6 is an external representation and
figures 7 and 8 are internal representations. Our three internal
representations had all come from only one external representation.
This clearly demonstrated what Janvier, Girardon and Morand [2]
describe as "homonymy" where one external representation (in this
case figure 6) can create more than one internal representation
(figures 7 and 8). As a teacher, I need to be aware that although
children may only be presented with one external representation, a
wide variety of internal representations may well occur as the
children interpret the representations in a variety of ways. I need
to allow the children plenty of opportunity to share their
interpretations to ensure they are interpreting the representation
in the way I had planned.
Representing ladybirds
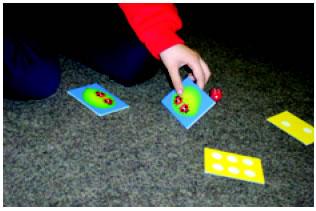
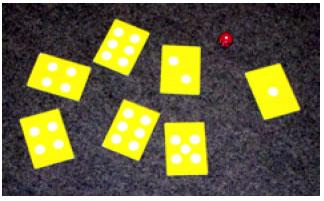
I regularly play a game with groups of children in my class
called "The Game of Ladybirds". It is a simple dice game that
involves placing a set of cards face down on the table. Each card
has a pattern of dots on the top, corresponding to those on the
faces of dice. The players take it in turns to throw a dice and
then turn over a card with the matching pattern on it. On the
reverse of each card are between zero and three ladybirds and the
player keeps this card. Players continue to take it in turns to
throw the dice and select a card, until all the cards in the middle
have been taken. The winner is the player with the most ladybirds
at the end of the game. It is a game that teaches the children to
recognise the number of spots on each side of a dice but also helps
them to count objects accurately when they count up their total at
the end of the game. However, I decided to use this game with
several groups of children to look at their ability to represent
information, and also to introduce block graphs as a representation
to the children for the first time.
We began by playing the game as normal. When we got to the
final stage of totalling up how many ladybirds we each had, I asked
them to count their own but keep the total a secret. I then gave
them each a piece of paper and a pencil and asked them, on their
own, to "put something on the
paper that would show me how many ladybirds you have got
altogether" . (I chose this phrase carefully so as not to
make any suggestions about whether I was expecting them to draw or
write on their paper.) The children chose to use a range of
representations, for example, Dana had three cards that contained
three, two and zero ladybirds. Her representations were iconic
(where an action or object is replaced by an image) since she chose
to represent her collection by drawing the five ladybirds as in
figure 9.
Image
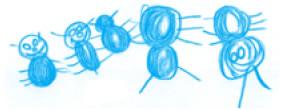
figure 9
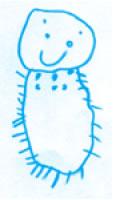
Thomas also chose an iconic representation. However, his
differed from Dana's in that he drew a large ladybird to represent
his collection of three ladybirds, but since he knew that each of
the original ladybirds had two spots, his new large ladybird had
six spots, see figure 10.
Image
figure
10
The other children were quite confused by Thomas' drawing. To them it appeared, quite understandably, that he had only got one ladybird. However, to Thomas it was perfectly clear. He was able to explain it to me with great confidence and reminded me, as Atkinson and Clarke point out:
"Children's own
symbols hold enormous meaning for them. For example, invented
symbols for price labels in the class shop, introduced and
interpreted by a child, can be accepted and understood by the class
for several weeks." [3]
I understood how Thomas must have felt since I had had a
similar experience myself in the college group when I had tried to
represent a large cube model; we were both learning the lesson that
what might appear clear to us, is not necessarily clear to others.
Thomas' interpretation also made me wonder if the instruction I had
given to him had misled him; I had asked him to, "put something on
the paper that would show me how many ladybirds you have got
altogether". It seemed that he had heard something more along the
lines of, "put all the ladybirds together on your paper" which
would explain why he had chosen to combine his three ladybirds into
one large one! In my attempt to not give too much instruction for
what I wanted Thomas to do, on reflection, I may not have been
clear enough.
Another child in the group, Austin, had collected five cards,
containing eight ladybirds in total. He chose to represent his
collection more symbolically, using small blobs to represent each
ladybird, as shown in figure 11.
Image

figure
11
Elizabeth chose
to represent her collection of thirteen ladybirds purely
symbolically, although the numerals were reversed, as shown in
figure 12.
Image

figure12
Graphing our ladybirds
Once each child had represented their collection of ladybirds themselves, I suggested that we put all the information together so we could see it all on one piece of paper. I wrote the names of the children in the group in a column and created a simple table. I asked the children how I could show how many ladybirds each of them had got on my table. Bailey suggested drawing the right number of ladybirds next to each name. I asked Austin to remind us of how he had chosen to represent his ladybirds and then, building on Austin's idea, I suggested to the group that we used an oval shape to represent each of the ladybirds. This group's results are shown in table 2.
Image
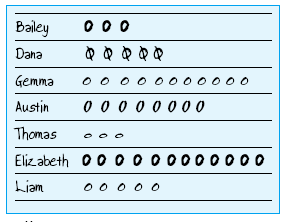
table 2
We discussed the information on this graph for a while and I
asked the children questions such as, "Who had the most ladybirds? " and,
"Who had five ladybirds? "
This helped the children to use the representation and begin to
interpret the information.
Image
I found that the children coped well
with the graph and were able to answer the questions I posed. I
also allowed them to all keep their original cards visible, which
maintained the link between the symbolic (using a code or symbols to
represent the object), the iconic (the object being replaced by
an image) and the enactive (where something is learnt by hands-on
experience) modes for them.
Since this small introduction to
block graphs was successful, I plan to follow it up with some work
on block graphs using a computer package that produces simple
graphs. It will be interesting to see if the children are able to
make the same connections when presented with the information in a
new format or whether they will face new problems.
Conclusion
Both the children and I have
experienced difficulties in understanding various representations
but when allowed enough time to reflect on the image, and sometimes
with the support and explanation of others, we have all experienced
the feeling of understanding the representations. Janvier, Girardon
& Morand put it very well when they state that:
" ... a representation should be viewed as a
seed that 'contains' a plant. The ground must be rich to welcome
it, and then there is the inevitable time factor. "
[2]
Image
As a teacher I need to ask myself
whether the representations I am giving children are within their
scope of understanding and ensure that the children are allowed
enough time to reflect and absorb or internalise the image for
themselves. As I have reflected on these experiences, this is the
question I have constantly returned to, "What does it say to you? " I must
continually ask that question of myself as I approach new
representations, and must ask it of children I am working with. I
must also encourage children to ask it of each other, as Atkinson
says:
"When we set maths in contexts that make
'human sense', and we allow children to use their own symbols, and
to develop their own meanings, we are respecting their view of the
world: "This is what I think, Amy. What do you think? ""
[4]
Gradually, we will all move forward in our understanding of
representations and begin to understand and be part of the power of
representation to facilitate the development of mathematics. But,
at the end of the day, a representation is only as powerful as what
it says to you ...
References
1 D. Pimm: Symbols and meanings in school mathematics , Routledge, 19952 C. Janvier, C. Girardon & J. C. Morand: Mathematical
symbols and representations, in Research ideas for the classroom: high school
mathematics, Macmillan Publishing Company, 1993
3 S. Atkinson & S. Clarke: Children's own mathematical
representations in Mathematics
with reason, Hodder & Stoughton, 1992
4 S. Atkinson (ed.): Mathematics with reason, Hodder &
Stoughton, 1992
This article was written by Sarah Holmes, a reception teacher at Davyhulme Infant & Nursery School, Manchester and was first published in Mathematics Teaching 186, a journal produced by the Association of Teachers of Mathematics. The article can also be found on the ATM website . We would like to thank Sarah and the ATM for allowing us to reproduce it here.
