30 April (Primary), 1 May (Secondary)
Whose Line Graph Is it Anyway?


You can use these printouts of the equations, the graphs without axes , the graphs with axes and the processes to create a card sorting activity.
Scientific processes involving two variables can often be represented using equations and line graphs.
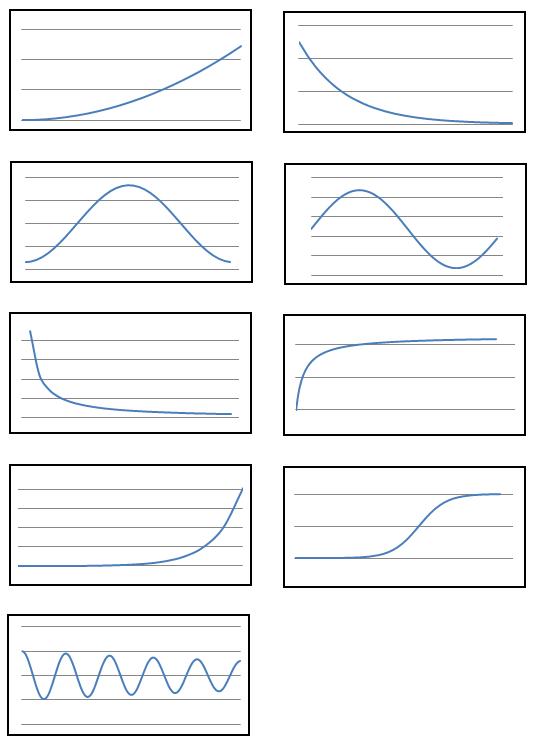
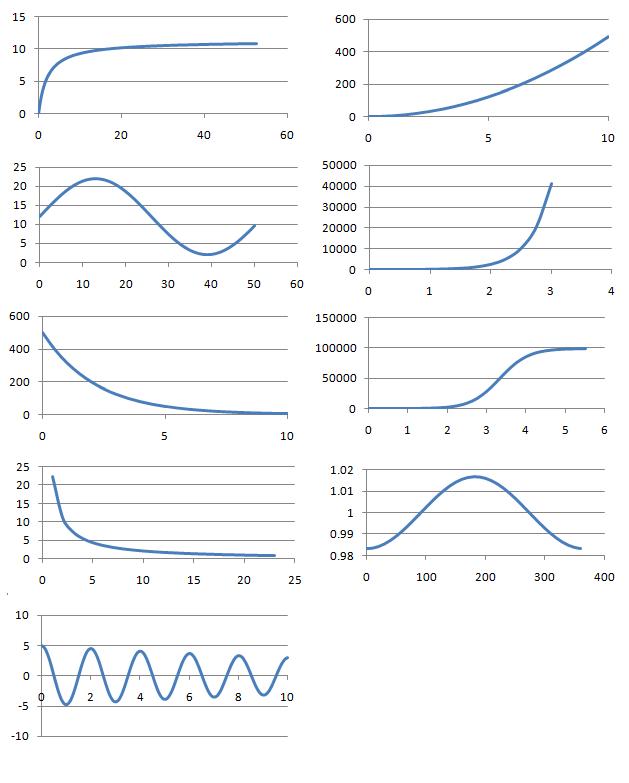
In this problem, $9$ processes, their equations and graphs have been mixed up and shown below. In each case, the two variables are represented by the letters $x$ and $y$ and the labels from the axes of the graphs have been removed.
Which can you match up? What is the interpretation of the variables $x$ and $y$ in each case?
Can you identify the physical interpretation of three key points on each of the graphs?
Processes
- Number of rapidly dividing bacteria present in a food-limited environment, starting from a small initial sample.
- Concentration in the blood of a drug following an injection.
- Angle of oscillation of a real pendulum of length $1$m in air.
- Volume (litres) against pressure (atmospheres) for $1$ mole of an ideal gas at $0^\circ$ C.
- Vertical distance travelled by a small, heavy ball dropped from a plane.
- Rate of reaction of a catalysed reaction in terms of the concentration of reagent.
- Number of rapidly dividing bacteria present in a food-rich environment, starting from a small initial sample.
- Hours of daylight per day in a town in the far northern hemisphere.
- Model of the distance of the Earth from the sun in astronomical units.
Line Graphs

Equations
A: $y(x) = 4.9 x^2$
B: $y(x) =500 \times 2^{-0.6667x}$
C: $y(x) =1- 0.01671\cos(0.0172 x)$
D: $y(x) = 12+10\sin(0.121 x)$
E: $y(x) = 5\cos(3.13 x)e^{-0.05x}$
F: $y(x) = \dfrac{11.3 x}{2.1+x}$
G: $y(x) =10 \times 2^{4x}$
H: $y(x) = \dfrac{1000000}{10+(100000-10)2^{-4x}}$
I: $y(x)x = 22.4133$
The numbers have been carefully chosen to represent certain time/length/unit scales for particular physical phenomena. Can you deduce the reason for the choice of any of the numbers?