Overlapping Squares
Problem

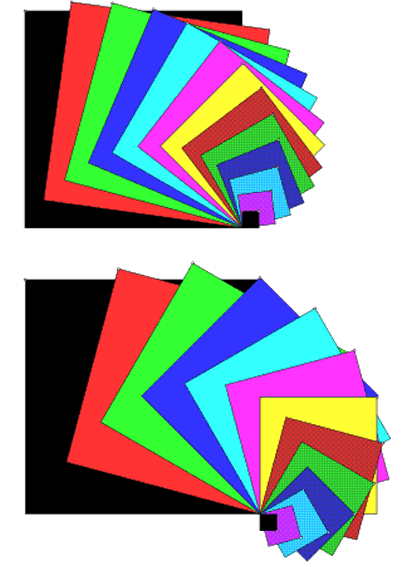
Describe what is happening in these pictures.
How many squares are there in each picture?
The smallest square is one unit of area. How many more units are in the second square?
Look at the top picture. Start from the largest square and think of it as shrinking as it turns.
Teachers' Resources
Possible approach
This image might be best displayed on an interactive whiteboard, or printed off on A3 paper for display. Alternatively, many classrooms now have access to data projectors so large images can be thrown onto a screen. The value of the use of the images with interactive whiteboards is the potential to be able to draw and add notation and ideas to the image as prompts for discussion, or as the
result of pupils' observations. Some interactive whiteboards also have tools that enable angles or lines to be measured so that comparison is made easy (failing this a metre rule and a board protractor can be equally effective).
The intention is that pupils will discuss and share insights about what they see within the image, with the potential for them to go on to use it as a focus for investigative activities.
There is a visual dynamic in this image that can be experienced as the squares approaching or receding, or giving the impression of spiralling up or down. This image gives opportunities for pupils to estimate and conjecture, and even justify their hypotheses. They will be using knowledge of area and angles in an intriguing context, and at the same time, they will be developing their mathematical
language.
Possible extension
You might wish to experiment with the following LOGO program:
TO SQ :N
