Match the Matches
Problem
Two football teams, Alpha United and Beta Rovers have each played fifteen games in their league.
The data below show how many goals the teams scored in their matches.
There are six different collections of data, three show the results for Alpha United and three show Beta Rovers' goals. Can you match the data to the teams?
Getting Started
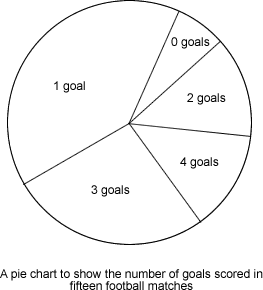
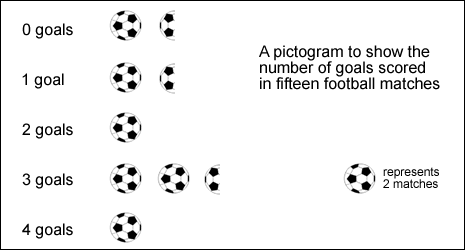
You could try comparing any two of the charts to start with. For example, do you think the pie chart and the pictogram represent the same team's goals? Why or why not?
How about comparing the pictogram and the tally chart?
Student Solutions
Someone from Brenchley and Matfield School sent in this excellently reasoned solution - unfortunately he or she didn't give us their name:
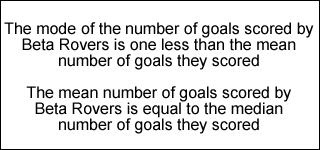
Alpha united (AU) and Beta rovers (BR) played 15 games each.
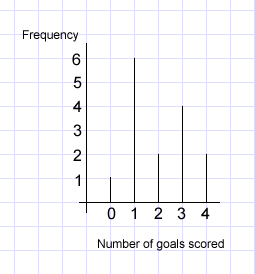
- The pie chart and the bar chart had the same amount of goals.
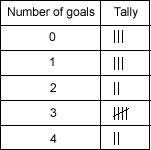
- The tally chart and the pictogram had the same amount of goals.
- I then did this to find the mean of the pictogram: 0x3=0 1x3=3 2x2=4 3x5=15 4x2=8 0+3+4+15+8 = 30 Divided by 15 =2.
- I then found the mode which is 3 because 3 goals was scored mostly
- Finally I found the median which is 2. 000111223333344
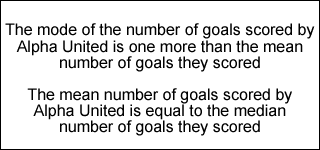
- The mode is 1 higher than the mean and the median is the same as the mean.
- This matches the data of the writing about AU.
- This means the pictogram and the tally chart are AU.
- This means the pie chart and the bar chart are BR.
- AU scored 30 goals.
- BR scored 30 goals.
George and Dominic from St Nicholas' C of E School, Newbury, also sent in a very clear solution:
We looked at the pictogram and worked out how many goals were scored altogether - that was 30.Well done also to Amelia and Antonia from Greenacre School for Girls; Alice from Baston C of E Primary; Isaac and Happy from Glenview Primary, New Zealand; Charlotte; Laraib from Wellington; Wiktorial and Maiyam from St Paul's Catholic School; and Parallel Rangers from Wexham Court, who also sent good solutions.
Teachers' Resources
Why do this problem?
Possible approach
- Looking at the pie chart, in approximately what fraction of the total number of games did the team score one goal?
- What does the tally chart show us?
