Data Duos
Problem
Here are four shapes (they are labelled A, B, C and D):

What do you notice?
In how many different ways could you sort the shapes?
Kerstin sorts the shapes in three different ways.
She creates a Venn diagram and a Carroll diagram for each way of sorting.
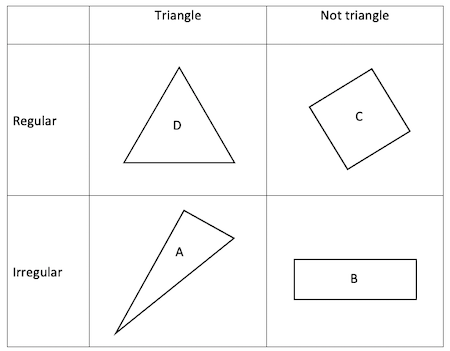
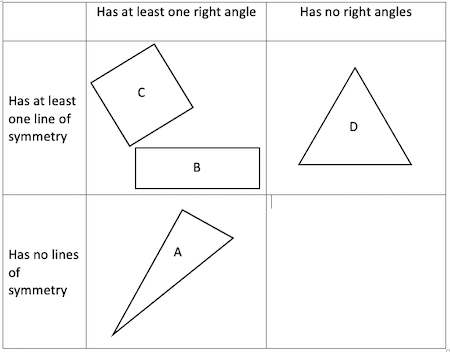
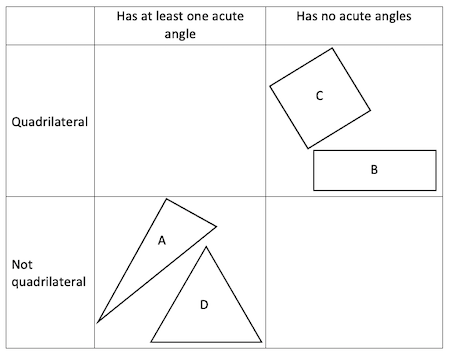
Here are the three Carroll diagrams she makes...
Carroll number 1:
Carroll number 2:
Carroll number 3:
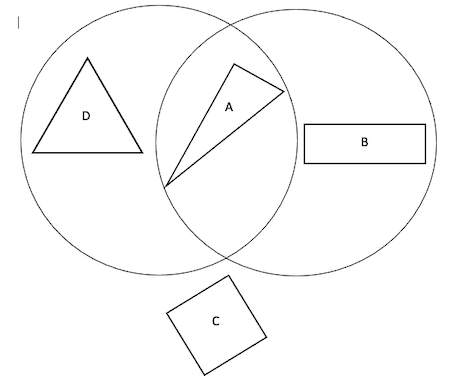
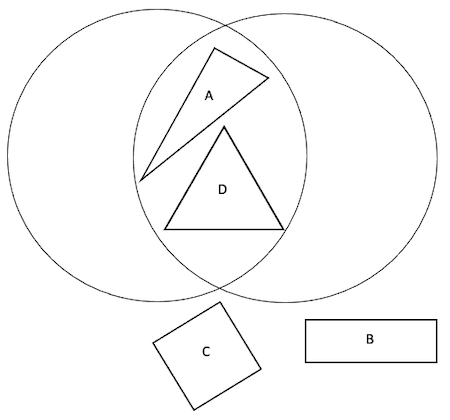
Here are the three Venn diagrams, but she hasn't labelled them yet.
Venn number 1:
Venn number 2:
Venn number 3:
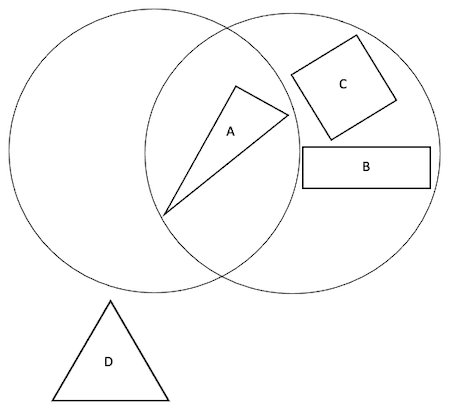
Can you match the Carroll diagram to the Venn diagram showing the same way of sorting the shapes?
Can you add labels to each Venn diagram?
We would love to hear about how you approached this task.
You may find it helpful to print out this sheet which has copies of all six diagrams on it.
This task was inspired by a 2009 SATs question.
Getting Started
Choose one of the diagrams. What does it show?
How will we find a Carroll/Venn diagram that matches it? What will we look for?
Why are two shapes in the same region/cell in some of the diagrams? How might this help us find the matching Venn/Carroll diagram?
Student Solutions
Thank you to everybody who sent in their solutions to this problem. Taylor said:
I chose the first one and I noticed that two of the shapes have 3 points and the other two have 4 points. Also two of the shapes have 3 sides and the other two have 4 sides. I noticed that the each of the two shapes that look similar are in common in many different ways.
Good ideas, Taylor! Ayan from the British International School of Houston in the USA said:
To match Venn 2 & Venn 3 I simply looked at the pairs. For example, on Venn 3 it shows two squares in one circle and on Carrol 2 it show the same two squares in the same box. This indicates that those two should be paired up.
Similarly, the same situation applies to Venn 2. Once Venn 2 and Venn 3 are paired up with their Carroll diagrams, there is only one Carroll diagram and only 1 Venn diagram left. Through process of elimination, we see that these two will have to match up.
Well done for working out which Venn and Carroll diagrams look similar, Ayan. We've uploaded a PDF of Ayan's solution.
I wonder if there are any different ways of working this out? If you have any ideas, please email us as we'd love to hear from you.
Teachers' Resources
Why do this problem?
This task develops learners' familiarity with Carroll and Venn diagrams in the slightly unusual context of geometry. It will encourage them to interrogate the data carefully and provides a 'reason to reason'.
Possible approach
This activity featured in an NRICH Primary webinar in March 2021.
Display the four shapes on the board and ask the class what they notice. Allow time for learners to think on their own before talking to a partner and then sharing ideas with the whole class (think-pair-share). As you take feedback, try to value everyone's contributions.
You may find that the idea of comparing and contrasting the shapes comes up naturally, and you can use this to lead into the first question. You might write up the different ways of sorting that the class suggest on the board.
At this point, it would be good not to say too much more. Give out the sheets of the six diagrams one between two and give some time for the class to look at each one without being explicit about the task at first. Encourage learners to share what they notice and any questions that they have with the whole class before explaining the task. (You may find that some pairs predict the task, or begin working on it before you spell it out but that does not matter at all!). If learners cut the sheet into six 'cards', they could physically put diagrams close together which might help.
In the plenary, you could invite several pairs to explain how they got started on the task, and how they worked through to their conclusion. Encourage appropriate use of geometrical vocabulary, and clear reasoning. You can ask pupils to say in their own words what they think another pair has said. This will help everyone follow the reasoning and feel empowered to seek clarification where appropriate.
Key questions
Tell me about this Venn/Carroll diagram. What does it show?
How will we find a Carroll/Venn diagram that matches it? What will we look for?
Why are these two shapes both in this region/cell? How might this help us find the matching Venn/Carroll diagram?
Possible support
Having the diagrams on individual cards will make comparison easier for some pupils. Encourage learners to talk about what each diagram shows outloud with their partner.
Possible extension
You could challenge learners to create another matching pair of diagrams for these four shapes.
