Whose Line Graph Is It Anyway?
Which line graph, equations and physical processes go together?
Problem
You can use these printouts of the equations, the graphs without axes , the graphs with axes and the processes to create a card sorting activity.
Scientific processes involving two variables can often be represented using equations and line graphs.
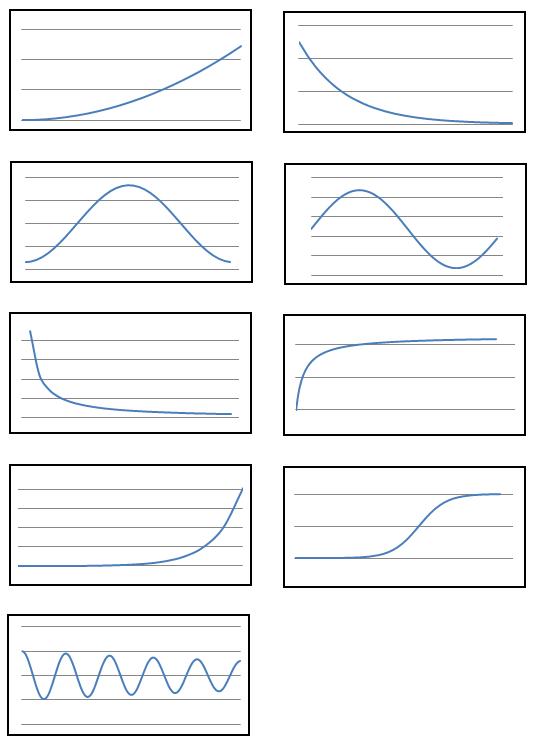
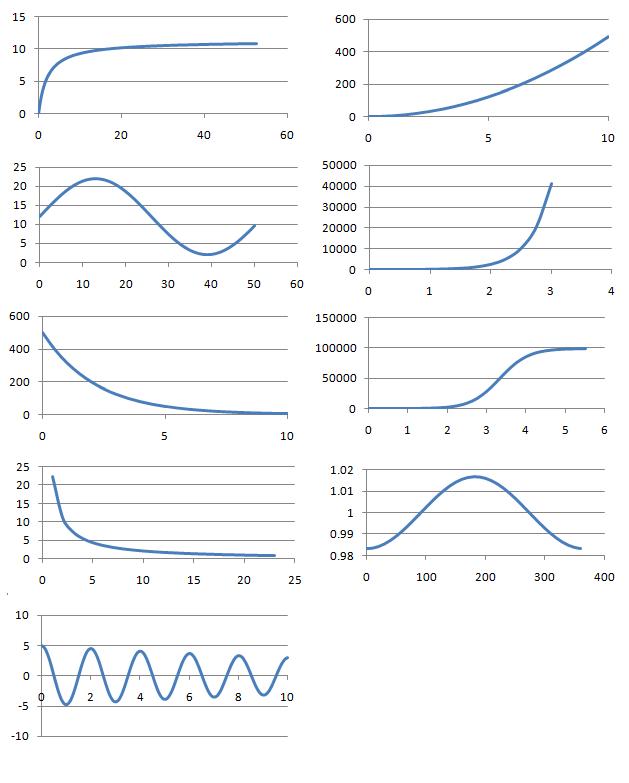
In this problem, $9$ processes, their equations and graphs have been mixed up and shown below. In each case, the two variables are represented by the letters $x$ and $y$ and the labels from the axes of the graphs have been removed.
Which can you match up? What is the interpretation of the variables $x$ and $y$ in each case?
Can you identify the physical interpretation of three key points on each of the graphs?
Processes
- Number of rapidly dividing bacteria present in a food-limited environment, starting from a small initial sample.
- Concentration in the blood of a drug following an injection.
- Angle of oscillation of a real pendulum of length $1$m in air.
- Volume (litres) against pressure (atmospheres) for $1$ mole of an ideal gas at $0^\circ$ C.
- Vertical distance travelled by a small, heavy ball dropped from a plane.
- Rate of reaction of a catalysed reaction in terms of the concentration of reagent.
- Number of rapidly dividing bacteria present in a food-rich environment, starting from a small initial sample.
- Hours of daylight per day in a town in the far northern hemisphere.
- Model of the distance of the Earth from the sun in astronomical units.
Line Graphs

Equations
A: $y(x) = 4.9 x^2$
B: $y(x) =500 \times 2^{-0.6667x}$
C: $y(x) =1- 0.01671\cos(0.0172 x)$
D: $y(x) = 12+10\sin(0.121 x)$
E: $y(x) = 5\cos(3.13 x)e^{-0.05x}$
F: $y(x) = \dfrac{11.3 x}{2.1+x}$
G: $y(x) =10 \times 2^{4x}$
H: $y(x) = \dfrac{1000000}{10+(100000-10)2^{-4x}}$
I: $y(x)x = 22.4133$
The numbers have been carefully chosen to represent certain time/length/unit scales for particular physical phenomena. Can you deduce the reason for the choice of any of the numbers?
Getting Started
How might you rule out certain pairs of graphs and equations?
Where are the key points on each graph?
For each process, roughly what shape graph would you expect?
Which graphs or equations might be consistent with this?
Once you have matched a process, equation and graph how would you construct very convincing evidence that the match is correct?
Student Solutions
Raquel from IES Maximo Laguna in Spain and Rishik K both chose the same graphs for the processes numbered 1 to 3. Below is Raquel's work, which also shows equations and reasons for the choices of constants (click on the image to open a larger version).

For processes 4, 5 and 6, Raquel correctly identified the correct equations and graphs. Here is Raquel's work (click on the image to open a larger version):

Raquel and Rishik both identified the graph for process 7 correctly. Below is Raquel's work which also includes the equation (click on the image to open a larger version):

For process 8, Rachel and Rishik agreed about the general shape of the graph, and Rachel chose the graph with the correct units. Here is Rachel's work for processes 8 and 9 (click on the image to open a larger version):

Teachers' Resources
Using NRICH Tasks Richly describes ways in which teachers and learners can work with NRICH tasks in the classroom.
Why do this problem?
This problem requires students to engage with the relationship between algebra, graphs and the physical processes from which they are derived. There is a strong modelling aspect to the problem which requires students to relate the decimal numbers in the expressions to key physical concepts.
Possible approach
This is well-suited to a card sorting approach. You can use these printouts of the equations, the graphs without axes , the graphs with axes and the processes. There is quite a lot of information for students to grapple with at the start of the problem and initially they might try to get a feel for the structure of the problem before attempting to pair cards together.
The simplest way into the problem is first to match the graphs and equations and then to match the processes onto these. Matching equations and graphs by a process of elimination is a good idea and students will need to realise that substituting $x=0$ or $x$ equal to the largest value on the horizontal axis is the best way to do this.
Students should be encouraged to try to get into the equations by looking at key points on the graphs (such as turning points, roots, asymptotes) and then deciding whether this might link well with a physical process.
Of course, some parts can be matched by process of elimination. However, the problem could be taken one step further: once students are confident that they have matched a process, graph and equation they should think about the match more carefully. Can they provide several different numerical/visual/physical common sense checks that the match is correct?
The most challenging aspect of the problem is deciding on the origin of the unusual-looking numbers, such as $3.13$ or $0.01671$. Reinforce to students that most of the numbers do result naturally from the physical process: all of the long decimals have an 'obvious' scientific origin. However, uncovering this origin will require students to think carefully about the physical process; there will doubtless be gaps in their scientific knowledge which make it likely that they will only be able to understand some of these fully.
Key questions
How might you rule out certain pairs of graphs and equations?
Possible extension
Possible support
Suggest that students try to substitute the values $x=0$ and the largest value on the horizontal axes of the graphs into the equations. Which match up?