Real statistics
Have a look at this table of how children travel to school. How does it compare with children in your class?
Problem
Census at School is an international project which collects data from children in participating countries all around the world, and makes it available for anyone to look at.
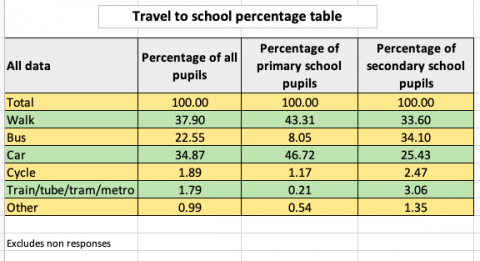
The table below contains data that was collected from the first questionnaires in Autumn 2000 and includes responses from children in England, Wales and Northern Ireland. It shows how pupils travel to school:
| All data | Percentage of all pupils | Percentage of primary school pupils | Percentage of secondary school pupils |
|---|---|---|---|
| Total | 100.00 | 100.00 | 100.00 |
| Walk | 37.90 | 43.31 | 33.60 |
| Bus | 22.55 | 8.05 | 34.10 |
| Car | 34.87 | 46.72 | 25.43 |
| Cycle | 1.89 | 1.17 | 2.47 |
| Train/tube/tram/metro | 1.79 | 0.21 | 3.06 |
| Other | 0.99 | 0.54 | 1.35 |
Which is the most popular way of getting to school for primary pupils?
How about for secondary pupils?
Can you think of any reasons why these might be different?
Which is the most common way of travelling to school overall?
Can you explain why this answer is different again?
What do you think the 'Other' category means?
What questions would you like to ask about the data?
Conduct your own survey on how everyone usually gets to school, perhaps in your class or year group.
Present your results in a table, chart or graph and please send it in to us.
Compare your findings to those in the table (you might want to look just at the primary school or secondary school data, depending on how old you are).
How are your results different?
Are there any similarities?
Can you think of any reasons why your findings might be different or similar?
Getting Started
How will you collect your own data?
Will you ask everyone individually?
How will you record what they say?
How many people are you going to ask?
How will you work out the percentage of people using each method of travel?
Student Solutions
We had a few different ideas sent in about this activity. Lyra from Westridge in the USA sent in these answers:
The most popular way for the primary students to travel to school is taking the car. The most popular way for the secondary students to travel to school is taking the bus. I think the primary students take the car and not the bus because on the bus, they go alone without their parents, and most of the time parents don't want their young kids going to places without them. I think the secondary students would take the bus because they are old enough to go to places without their parents, and taking a bus makes it very sociable and to me older kids are more sociable than younger ones. The most common way of traveling to school in all is walking. I think walking is popular because it is good exercise, and safe for the planet. I think the 'other' category means anything other than what they listed.
Well done, Lyra - I wonder what methods of transport might be included in the 'other' category?
Ilham from St Aidan's Catholic Primary Academy in England said:
The most popular way primary pupils get to school is by car since 46.72% of students travel like this which is the largest number in that column. Most secondary pupils prefer to go by bus with 34.1% going with this type of transport.
There is a difference between the ways primary school and secondary school students travel because secondary school students are older whereas younger students will need to rely on a parent/guardian to take them to school. Overall, walking is most popular with 37.9% of all pupils preferring this way.
This answer is different as we take the average of primary school and secondary school pupils. The "Other" category might, perhaps, represent people who use two or more methods of transport to get to school or any other types of transport not listed (e.g. taxi, rickshaw, etc.)
Thank you for sending in those ideas, Ilham! I particularly like the idea that the 'other' category might include children who use more than one method of transport to get to school. Are there any other ways of including these children in the table?
Aadit from Bayanami Public School in Australia had a different idea about why walking might be the most common method of travelling to school overall:
Most people live close to the school their child goes to so they can walk to school.
Vihaan, also from Bayanami Public School, had some more ideas about what the 'other' category might include:
Travelling by boat or plane etc.
I wonder which of those would be more common, and why? Thank you both for sending in your solutions!
Unfortunately, we haven't been sent any results of surveys that you have carried out yourselves. We would love to hear about them if you do - please email us so we can see how they compare with the data from Census at School.
Teachers' Resources
Why do this problem?
Possible approach
Key questions
How will you collect your own data?
Will you ask everyone individually?
How will you record what they say?
How many people are you going to ask?
How will you work out the percentage of people using each method of travel?
Possible extension
Children could be encouraged to interrogate other surveys in newspapers or magazines in a similar way. You could collect some suitable articles for them to look at and challenge them to ask questions about the data presented.
Possible support
Software packages can help pupils present their findings in a number of different ways.

