Copyright © University of Cambridge. All rights reserved.
'Witch of Agnesi' printed from https://nrich.maths.org/
Show menu
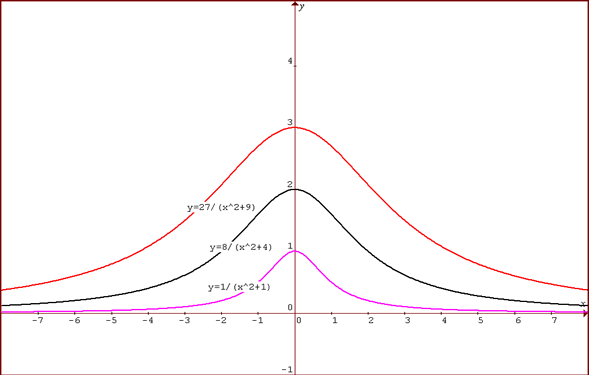
Sanjeet sent us this graph, showing the three curves on the same graph:

For different values of $a$ the graphs have the equation: $$y = {a^3\over (x^2+a^2)}$$ Differentiating $${dy\over dx} = - {2a^3x\over (x^2+a^2)^2}.$$ So the critical value is at $(0,a)$. Near this point, for small negative $x$ the gradient is positive and the function increasing and for small positive $x$ the gradient is negative and the function decreasing so this is a maximum point.
The value of $y$ is always positive so the entire graph lies above the $x$ axis and the graph is symmetrical about $x=0$ because $f(-x)=f(x)$.
For large $x$ the value of $y$ tends to zero so the line $y=0$ is an asymptote.