Links to the University of Cambridge website
 Links to the NRICH website Home page

Nurturing young mathematicians: teacher webinars
30 April (Primary), 1 May (Secondary)
30 April (Primary), 1 May (Secondary)
Resources tagged with: Trigonometric functions and graphs
There are 3 results
Broad Topics > Coordinates, functions and graphs > Trigonometric functions and graphs
Problem
Primary curriculum
Secondary curriculum
What's That Graph?
Can you work out which processes are represented by the graphs?
Age 14 to 18
Challenge Level 

Problem
Primary curriculum
Secondary curriculum
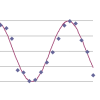
Back Fitter
10 graphs of experimental data are given. Can you use a spreadsheet to find algebraic graphs which match them closely, and thus discover the formulae most likely to govern the underlying processes?
Age 14 to 18
Challenge Level
Problem
Primary curriculum
Secondary curriculum
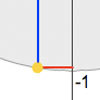
Sine and Cosine
The sine of an angle is equal to the cosine of its complement. Can you explain why and does this rule extend beyond angles of 90 degrees?
Age 14 to 16
Challenge Level