I used ‘Picture this!’ with a group of five first-year Cambridge undergraduates. We tried the activity at the end of their second term in Cambridge; they learned about Euclid’s algorithm during their first term, so I was hoping that this would revise some ideas and give them another way to visualise them (but at no point did I say anything that could have hinted that it might be about Euclid’s algorithm).
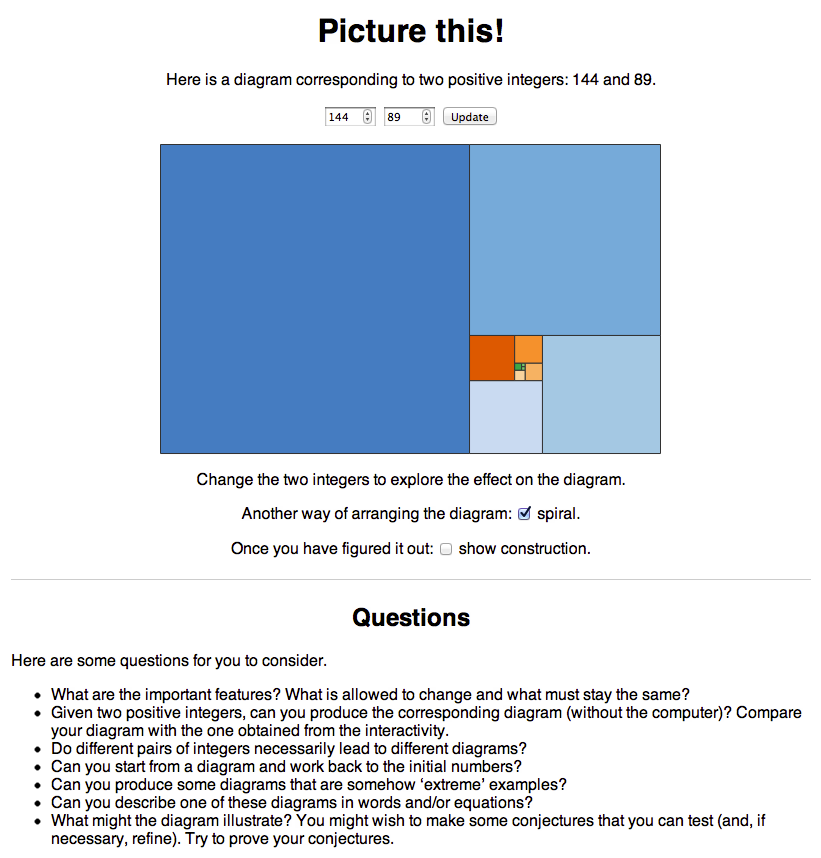
I displayed the interactive picture and accompanying questions using a data projector. I explained that I wanted them to study the picture and think about the questions. I told them that they could try changing the numbers themselves, when they were ready (but this involved one of them getting up to do it, so they weren’t too keen to do it too frequently). I didn’t say anything else, and just sat silently at one side.
I was delighted by the conversation that arose during the following 40 minutes or so (with absolutely no intervention from me). They chose to spend some of the time discussing things together, and some of it working individually in silence. Here are some of my notes on what was being discussed, including a few quotes of things that the students said.
There was an Initial discussion about spirals and the golden ratio. They tried changing the numbers a couple of times.
“Did the starting picture go on to infinity?” “No, I’m sure it stopped somewhere.”
Someone chose to draw the picture for 2, 3 and then someone else changed the numbers, so she found herself trying to describe the picture to someone else from memory.
“It’s a bit like Euclid’s algorithm.”
When trying to draw their own examples: “Don’t know the size of the smallest square”.
“Get the same diagram.” “Same diagram but scaled.” “Can’t tell how big the diagram is.”
Referring to Euclid’s algorithm and pointing at something on a piece of paper: “The number of squares is this bit here.”
They tried some numbers and compared with the output from Euclid’s algorithm.
“If one is a multiple of the other, you’ll get a lot of squares of the same size.”
They were keen on getting squares of different colours. “If you have enough you get orange ones, like the first one.”
Then some discussion about how to get orange squares.
“Can you put decimals in?” “No, that’s silly.” “Let’s try.” “It says ‘integers’.”
After some time of working hard individually, one person went to the computer to try 144, 89 - they were very excited to have so many colours!
More discussion about the golden ratio and Fibonacci numbers.
“I’m working out the best numbers to start with to get lots and lots of squares.”
Some discussion of: “Fibonacci numbers next to each other”.
We spent the last ten minutes or so discussing what they’d found, with me trying to bring their ideas together. They had clearly identified that the picture linked to Euclid’s algorithm, and could describe articulately how. Most seemed to like having another way to visualise Euclid’s algorithm. They’d thought about which numbers require many iterations and which require few, although they hadn’t developed this all the way to proofs (e.g. that consecutive Fibonacci numbers are ‘worst’). They had been a bit puzzled by the question about formulating and proving conjectures. We discussed the ‘bathroom tiling’ argument that uses this picture to prove that the side length of the smallest square is the highest common factor of the side lengths of the starting rectangle, and they could see how this related to the proof they’d seen before.
Overall, I was very pleased with the conversations that arose as well as the level of understanding at the end of just one hour, and I shall certainly use Picture This! in a similar way in the future (as well as using it with groups who have not yet met Euclid’s algorithm).