The following five functions have been plotted accurately on the
chart below
$$y=\sqrt{x}\quad\quad y=x^2\quad\quad y=x\quad\quad
y=x^2+x-1\quad\quad y=2\sqrt{x}-x$$
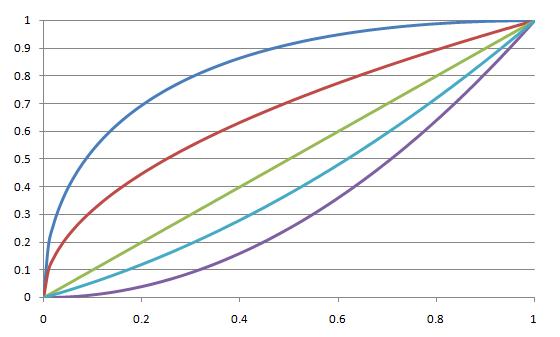
Which is the $x$-axis and which is the $y$-axis? Which curve
corresponds to which function?