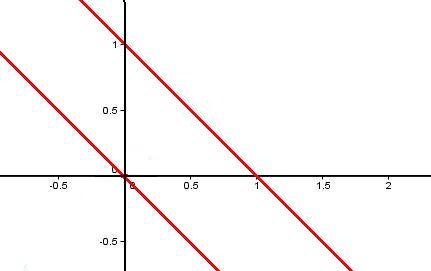
I used a graphical package to draw these 6 curves on the same set
of axes:
I was surprised to find that only 3 graphs appeared to show on
the output:
Can you explain what has happened? Can you work out which curves
go with which lines? Are there any points missing from the
graphs? If so, where should these be?
Can you think of any others sets of curves which might fool the
computer?
For investigating these graphs you can download the shareware
program Graphmatica for free from here as
NRICH is an approved distributor of this program. You can find
more information about the program from http://www.graphmatica.com/
.