In one sense it might seem odd that the first way we are taught to represent the
position of objects in mathematics is using Cartesian coordinates when
this method of location is not the most natural or the most convenient.
For a start, you have to use negative as well as positive numbers to describe
all the points on the plane and you have to create a grid (well axes) to use
as a reference.
When you ask a child where they left their ball they will say "just over
there" and point. They are describing (albeit very roughly) a distance
"just"
and a direction "over there" (supported by a point or a nod of the head).
When you ask someone where their town is they often say things like "about
miles north of London". Again, a distance and direction.
It is not very often that someone gives the latitude and longitude of
their town!
The use of a distance and direction as a means of describing position
is therefore far more natural than using two distances on a grid. This
means of location is used in polar coordinates and bearings.
The polar coordinates of a point describe its position in terms of a distance
from a fixed point (the origin) and an angle measured from a fixed direction
which, interestingly, is not "north" (or up on a page) but "east"
(to the right). That is in the direction
on Cartesian axes. So: In the plane we choose a fixed point
, known as "the pole". Then we choose an axis
through the pole and call it the "polar axis".
We now need a way of describing these points in a way that is efficient
and understood by everyone.
We say that
are the polar coordinates of the point
, where
is the distance
is from the origin
and
the angle between
and
. Here are some points on a plane and a list of five sets of Polar coordinates.
Can you
match the points to their coordinates (answers at the end of the article).
I have added some circles to help with the distances.
So far I have measured the angles in degrees
but the normal convention is to use radians
. There are
radians in a full turn. That is:
Looking at one of our points in the list above
would be
if the angle is measured in radians. Can you write each of the other pairs of polar coordinates above using
radian measure? (Answers at the end of the article).
There are in fact an infinite number of ways you can write any point
using polar coordinates because you can always add
, or
,
or
... to the angle and still end up pointing in the same direction!
In the example above the general coordinates for
would be
,where
is an integer.
This also means that the polar coordinates of the pole
are
where
can be any angle.
The Relationship Between Polar and Cartesian Coordinates
Imagine a point
which has polar coordinates
.
Let's try to use this information to give the Cartesian coordinates of
We can drop a perpendicular from the point
to
meeting
at
.
The lengths of
and
represent the
and
coordinates,
in Cartesian form, so we just need to find these two distances.
Therefore the Cartesian coordinates of
are
Now let's work the other way: We start with a Cartesian coordinate system. We will take the Cartesian coordinates of
as
Now we are trying to find
and
in terms of
and
Now we need
such that
and
It is tempting to say that
but there is a
danger in doing this that you might end up with the wrong value of
because of the signs of the trigonometric ratios in each quadrant.
For example: If
were the point
you would obtain a value for
and you would not know whether
or
!! By using the signs of
and
, you can be sure you have
the angle in the correct quadrant. So let's end by using this coordinate system. It would be good to try
out some equations and look at their graphs (polar plots).
Let's look at some examples:
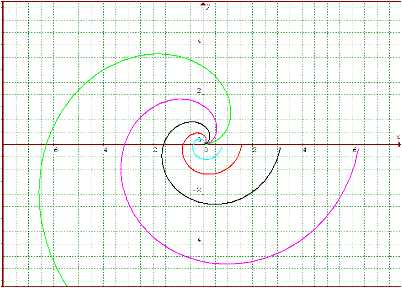
Consider the graph:
This has a spiral shape (each point moves out from the centre as the
angle grows).
The diagram below shows graphs of
for different
values of
, can you work out what they are?
Now its your turn. A graphical calculator or graphing package
such as graphmatica
would be very helpful!
What would the series of graphs
... look like? How about
for different values of
? These
graphs are called cardioids by the way.
Answers:
And
Scrunch it up to make a fan round a point, or . . . .
. . . . how to use an xy plot to help visualise the polar
plot
When you are trying to imagine what the polar plot of a function will look
like it can sometimes be helpful to look first at the Cartesian (xy) plot
for that function using values
and then
imagine
the graph turned into a fan.
Picture the x-axis pulled into a point with the function values fanned out
around it.
For example :
looks like this as a Cartesian plot.
But as a polar plot
is :
Over the
interval the graph
has
regions In region
the function rises to a maximum value of
and then falls
back symmetrically to zero. In region
the function falls further to a minimum value of
before
climbing back to zero. Notice the position of region
on the polar plot :as
sweeps the
second quadrant
thevalues of r are all negative, projecting
each plot point backwards into the fourth quadrant. Region
is straightforward like region
, while region
, like region
, also has negative
values and therefore plots in the second quadrant.
Now try
: First sketch an xy plot, then scrunch it up to make a fan round a point. After
you have sketched the polar plot use a graphical calculator or a graph plotter
to confirm your drawing. Invent some functions of your own to play with. For example suppose I stay
with the form
,
was
initially then
. How
will the appearance of the polar plot be effected by varying values of
?
Have fun.