Elizabeth from the International School of Geneva, someone from Winchester
College who gave no name and Andrei from Tudor Vianu National College,
Bucharest, Romania all sent solutions to this problem.
Elizabeth factorised the expression as follows:
and plotted the graphs of
and
.
Andrei factorised the expression differently
and plotted the graphs of
and
but you
should be able to see that the results are equivalent.
Our friend from Winchester College used the difference of two
squares to arrive at the same form of this result as Andrei and
another method would be substitution in the formula for the solution
of a quadratic equation.
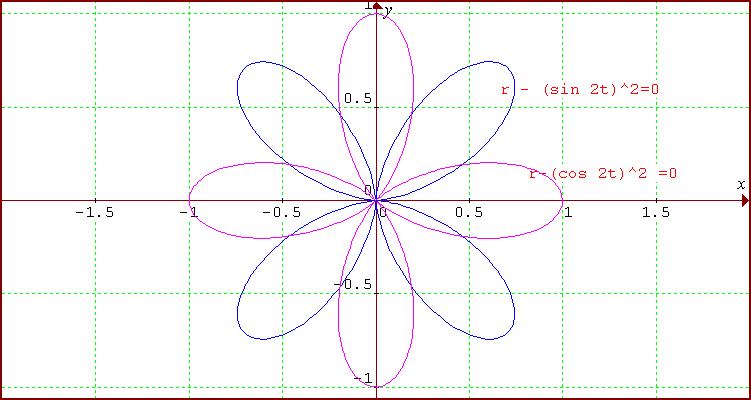
Consider first the graph of
in polar
coordinates where
is the length of the line segment from the
point from the origin and
is the angle measured counter
clockwise between this line segment and the positive
axis. For
points on this graph, as
increases from 0 to
we have
increases from 0 to 1. Between
and
the value of
decreases from
1 to 0 so that the graph in the first quadrant is a 'petal'
symmetrical about the line
.
Similarly the graph in the second quadrant is a 'petal' for
between
and
where
takes
positive values corresponding to
. The graph in the
third quadrant is a 'petal' for
between
and
and the graph in the fourth quadrant is a 'petal'
for
between
and
.
Next consider the graph of
. This will be of
the same form but rotated by
corresponding to the
phase shift between the graphs of
and
.
For points on this graph, as
increases from 0 to
we have
decreases from 1 to 0. Between
and
the value of
increases from 0 to 1 and between
and
, as
decreases from 1 to 0, the 'petal' symmetrical about
the y-axis is completed.
The next petal, symmetrical about the negative x-axis, is drawn
for
between
and
. The
next petal, symmetrical about the negative y-axis, is drawn for
between
and
and the
remaining petal is completed for
between
and
.