Copyright © University of Cambridge. All rights reserved.
'Charting More Success' printed from https://nrich.maths.org/
Show menu
If you are a teacher, click here for a version of the problem suitable for classroom use, together with supporting materials. Otherwise, read on...
This problem explores the same ideas as Charting Success.
Below are some graphs, charts and diagrams created by sports statisticians, trainers or competitors to help them to analyse performance, inform training programmes or improve motivation.
For each diagram, consider the following questions:
- What information can you deduce from each diagram?
- Are the diagrams effective in communicating the information?
- If you were a sports coach (for the team in question, or perhaps their future opponents), how might you use the information in each diagram?
- Do the diagrams raise any interesting questions for you? Is there a story to be told?
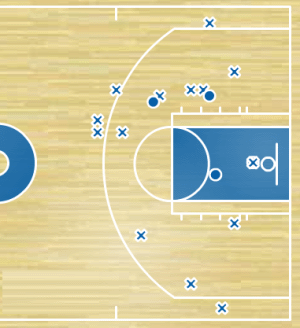
Baskets made (o) and missed (x) in the fourth quarter of a basketball match
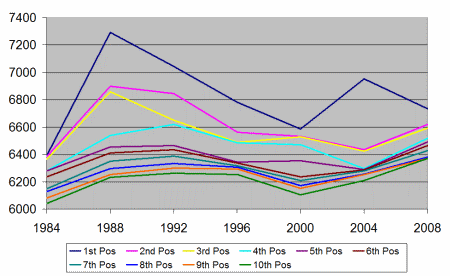
Finishing Scores of top ten athletes in Olympic heptathlon
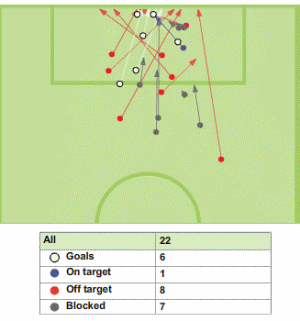
Shots on and off target for one team in a football match