Copyright © University of Cambridge. All rights reserved.
'If the World Were a Village' printed from https://nrich.maths.org/
Show menu
A gallery based on the book 'If the World Were a Village' by David J Smith and Shelagh Armstrong has opened and needs some exhibits. All of these must be based upon the data from within the book. It is important to be thoughtful about how the data are presented because sometimes key messages can be missed out because of the way the data are shown.
In the book, the world's population ($6, 660, 000, 000$) is represented in the imaginary village of $100$ residents so that each resident represents approximately $67$ million people from the real world.
Here's an example:
In the village, there are $100$ people:
 or
or 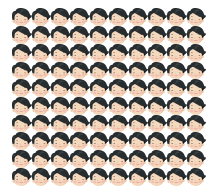 or
or 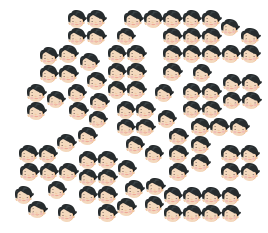
What do you think?
In your opinion, which shows us the $100$ people in the best way?
Here's another example:
In the village, $61$ people are from Asia; $13$ are from Africa; $12$ are from Europe; $8$ are from South America, Central America and the Caribbean; $5$ are from Canada and the United States; $1$ is from Oceania. How shall we represent this?
This time $1$ flag represents $1$ person.
|
Asia |
$61$ |
|
Africa |
$13$ |
|
Europe |
$12$ |
|
South America, Central America and the Caribbean |
$8$ |
|
Canada and the United States |
$5$ |
|
Oceania |
$1$ |
or
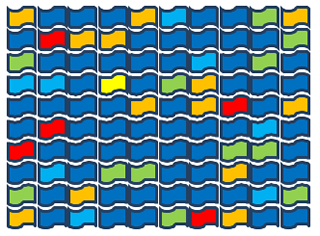
or
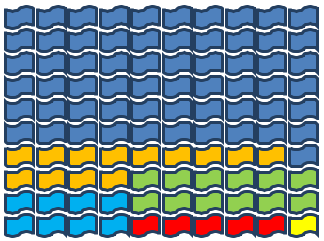
or
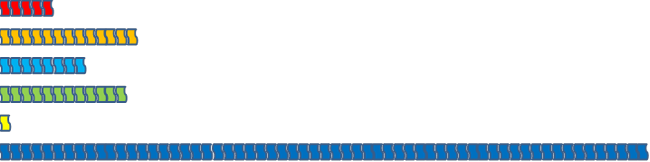
What do you think? All of them show exactly the same information.
Which representation makes you realise that there are $100$ people? Which one makes you realise that there are LOADS more people from Asia than anywhere else? Which was easiest to count? Did you notice how a flag had been used because that was linked to the topic?
Your challenge will be to decide how to represent some more of the data from the book. Here are some suggestions but you could choose your own data if you have a copy of the book.
Electricity:
$76$ have electricity. $24$ do not.
In the village, the people with electricity have between them: $42$ radios, $25$ televisions, $61$ telephones and $15$ computers.
Air and Water:
$82$ have access to a source of safe water either in their homes or within a short distance. $18$ do not and must spend a large part of each day simply getting safe water. Most of the work of collecting water is done by women and girls.
$64$ have access to adequate sanitation - they have public or household sewage disposal - while $36$ do not.
$68$ breathe clean air, while $32$ breathe air that is unhealthy because of pollution.
We are looking forward to seeing your different representations.
Many thanks to Vivien Townsend for creating this activity and the accompanying teachers' notes.