Copyright © University of Cambridge. All rights reserved.
'Olympic Records' printed from https://nrich.maths.org/
Show menu
Olympic Records printable sheet - graphs
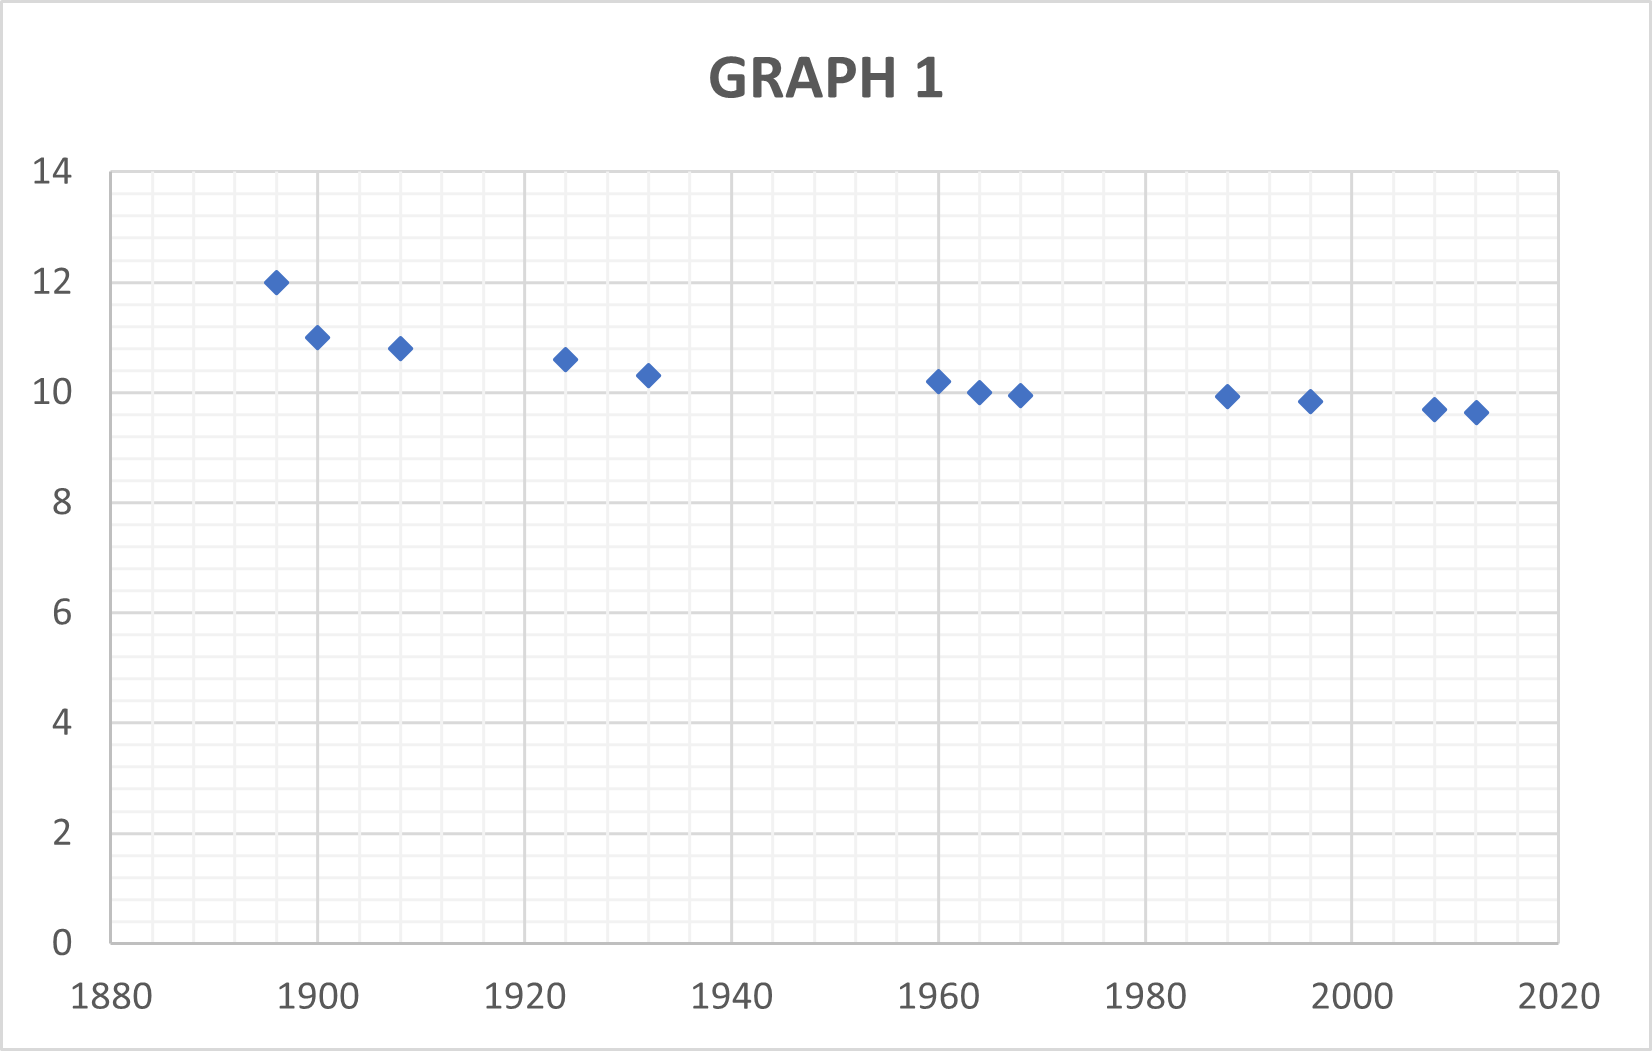
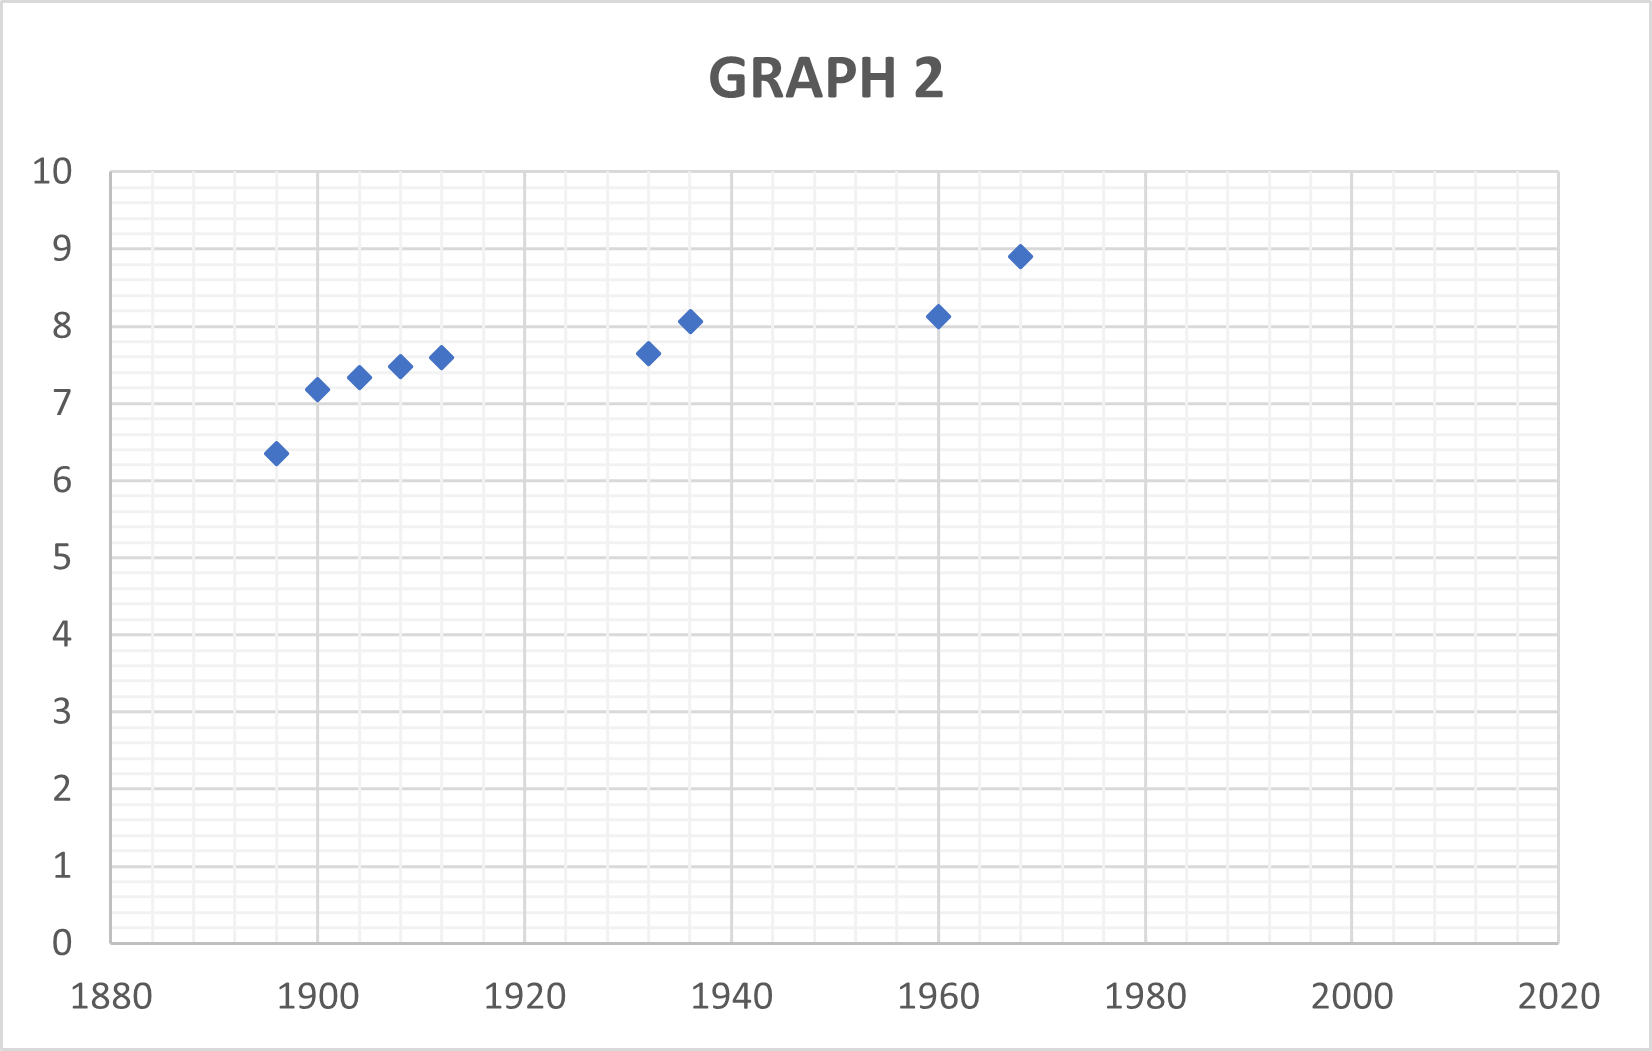
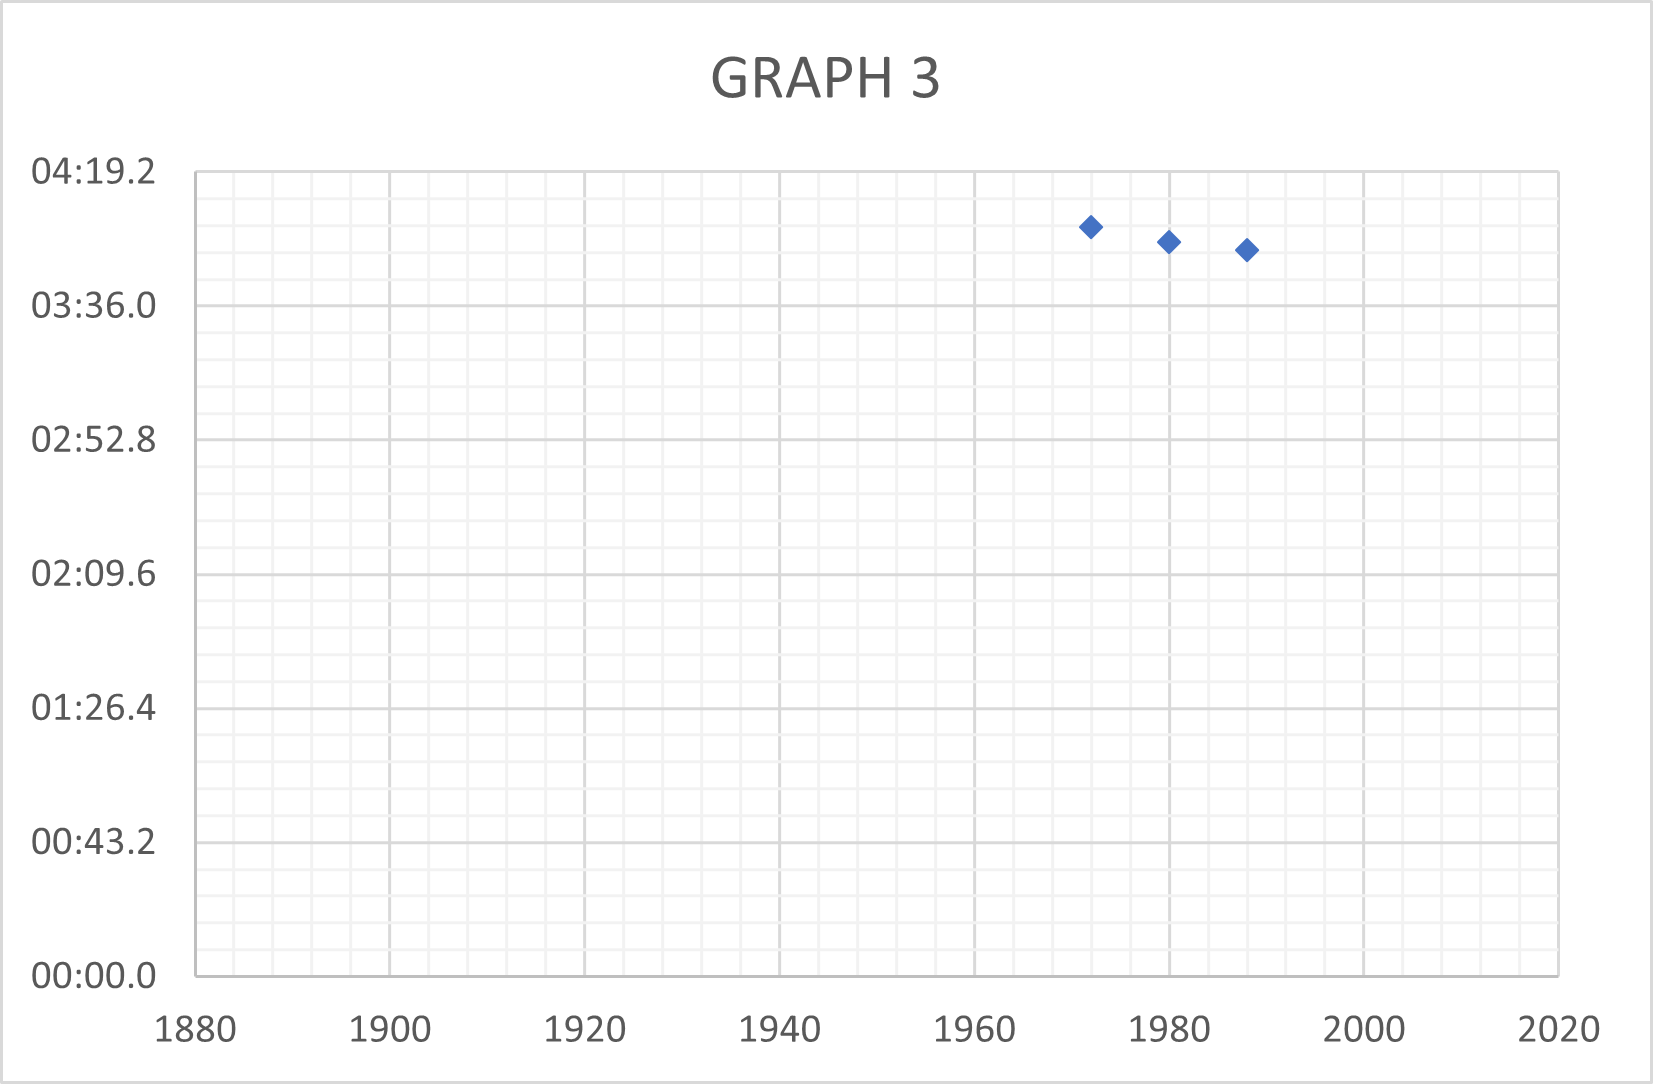
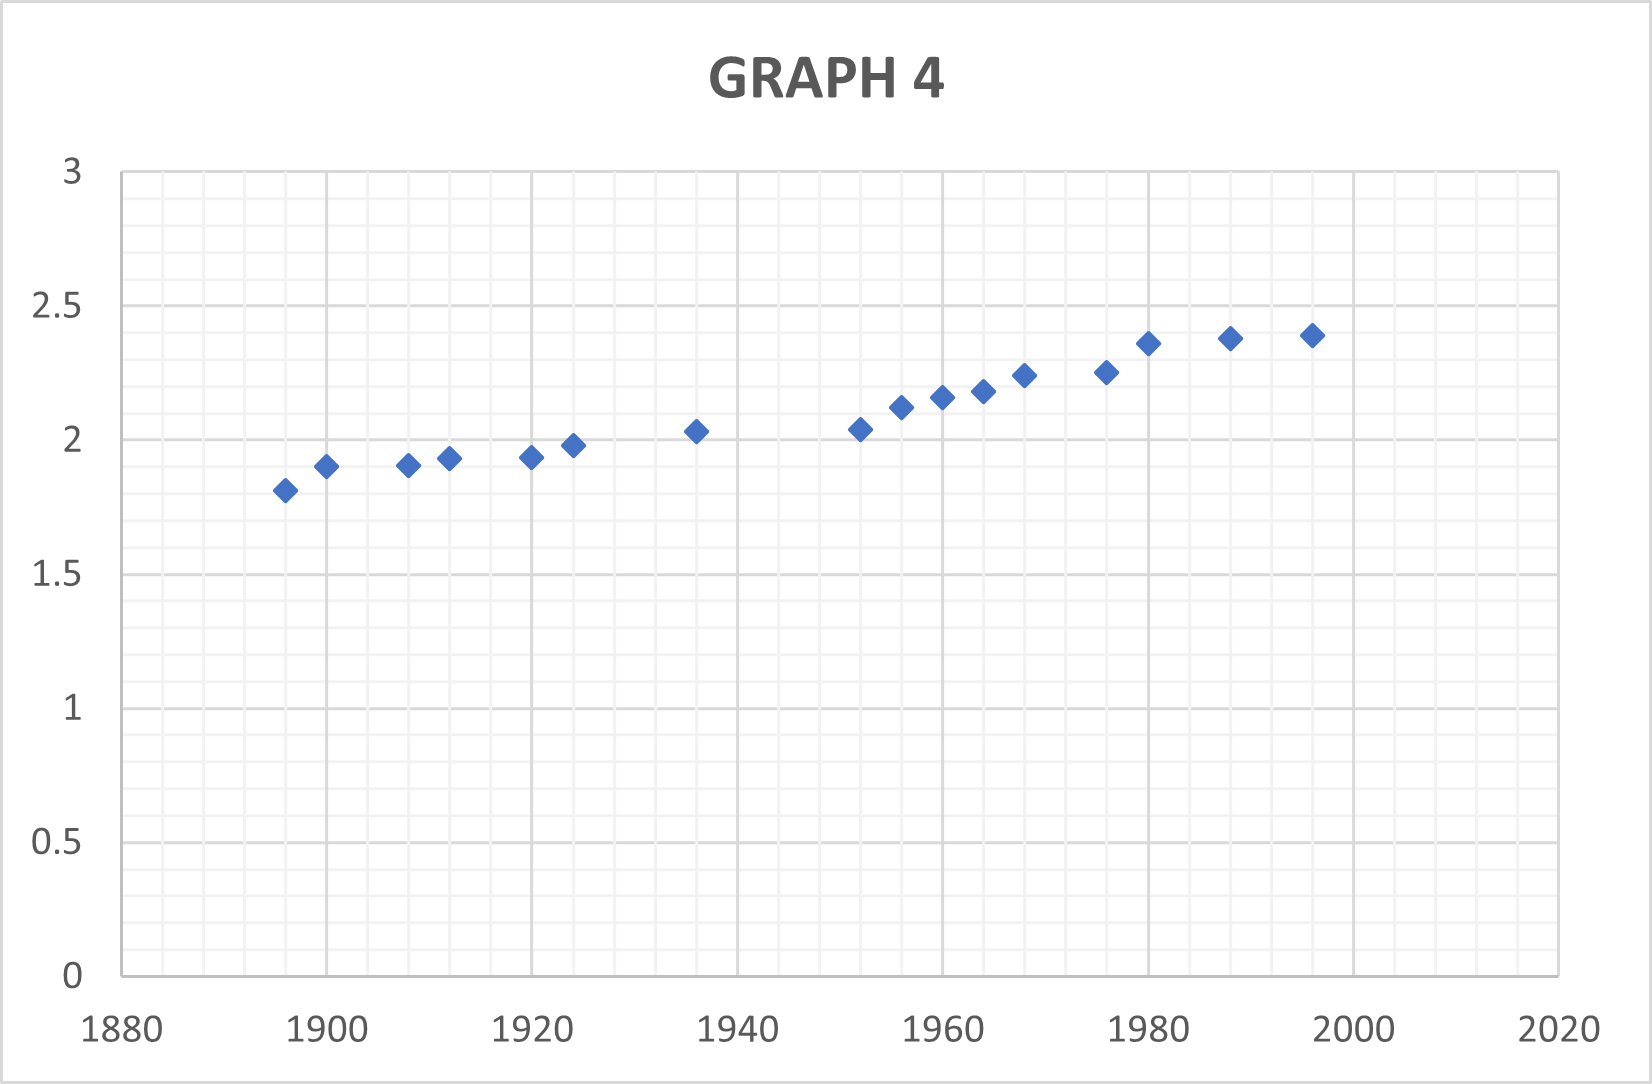
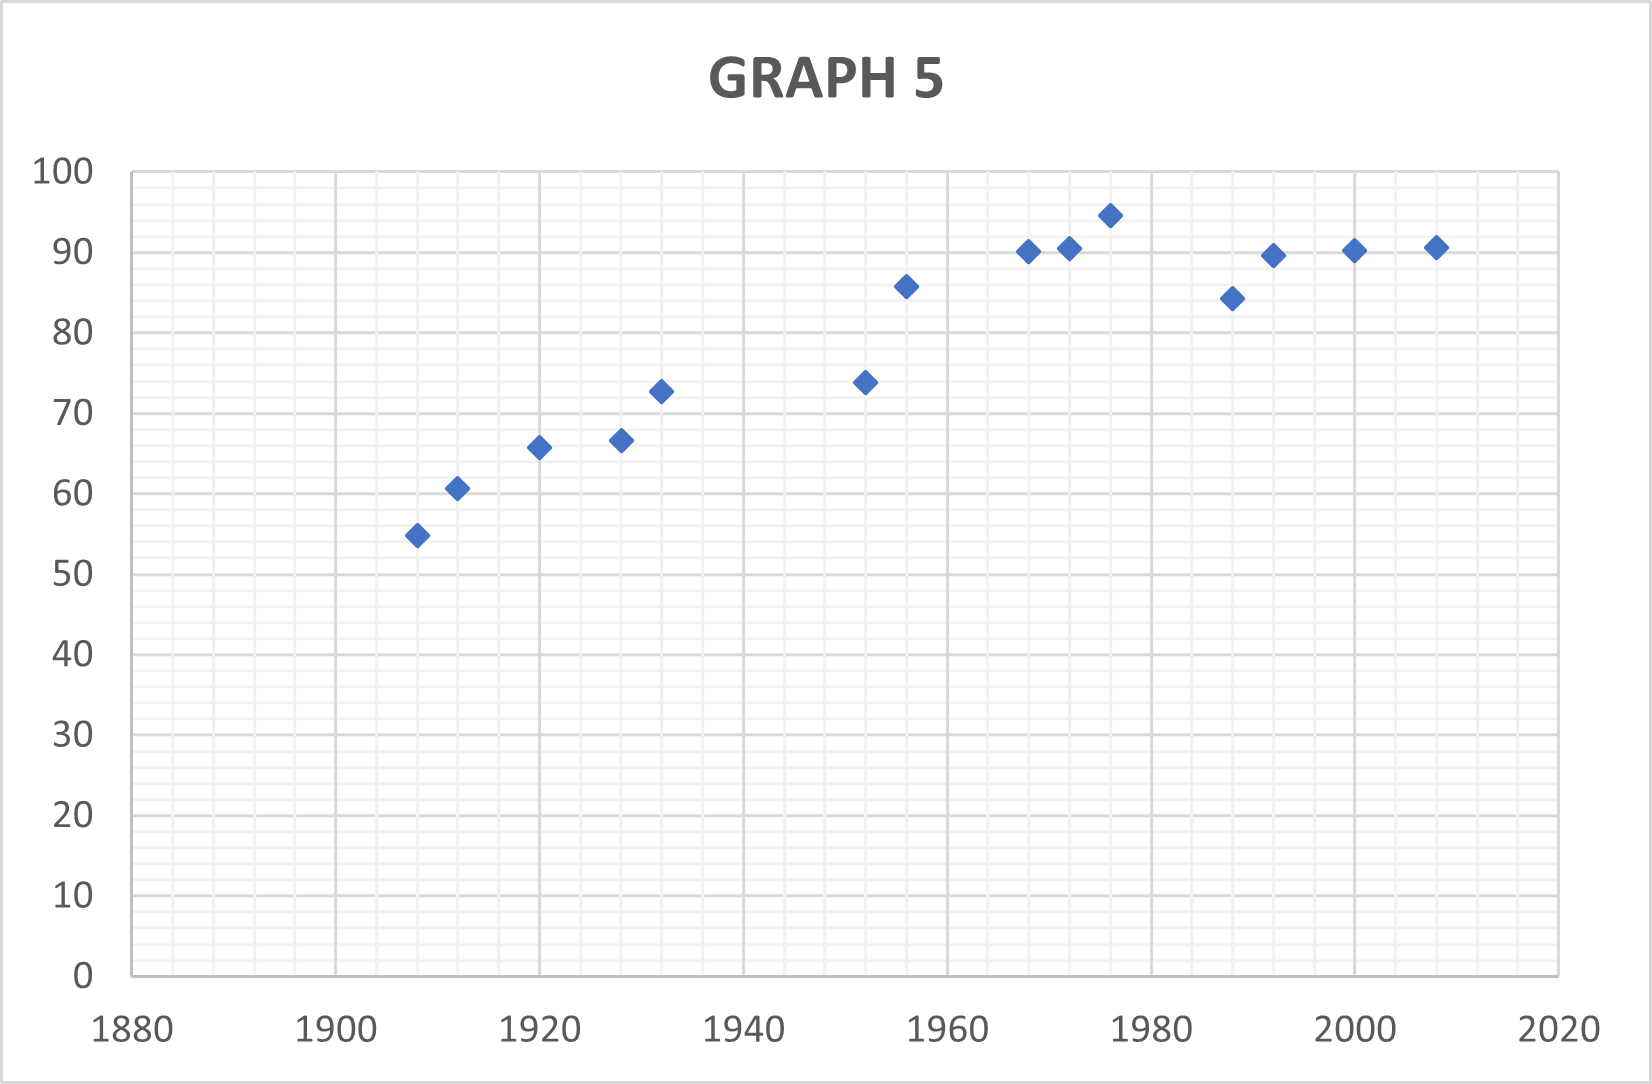
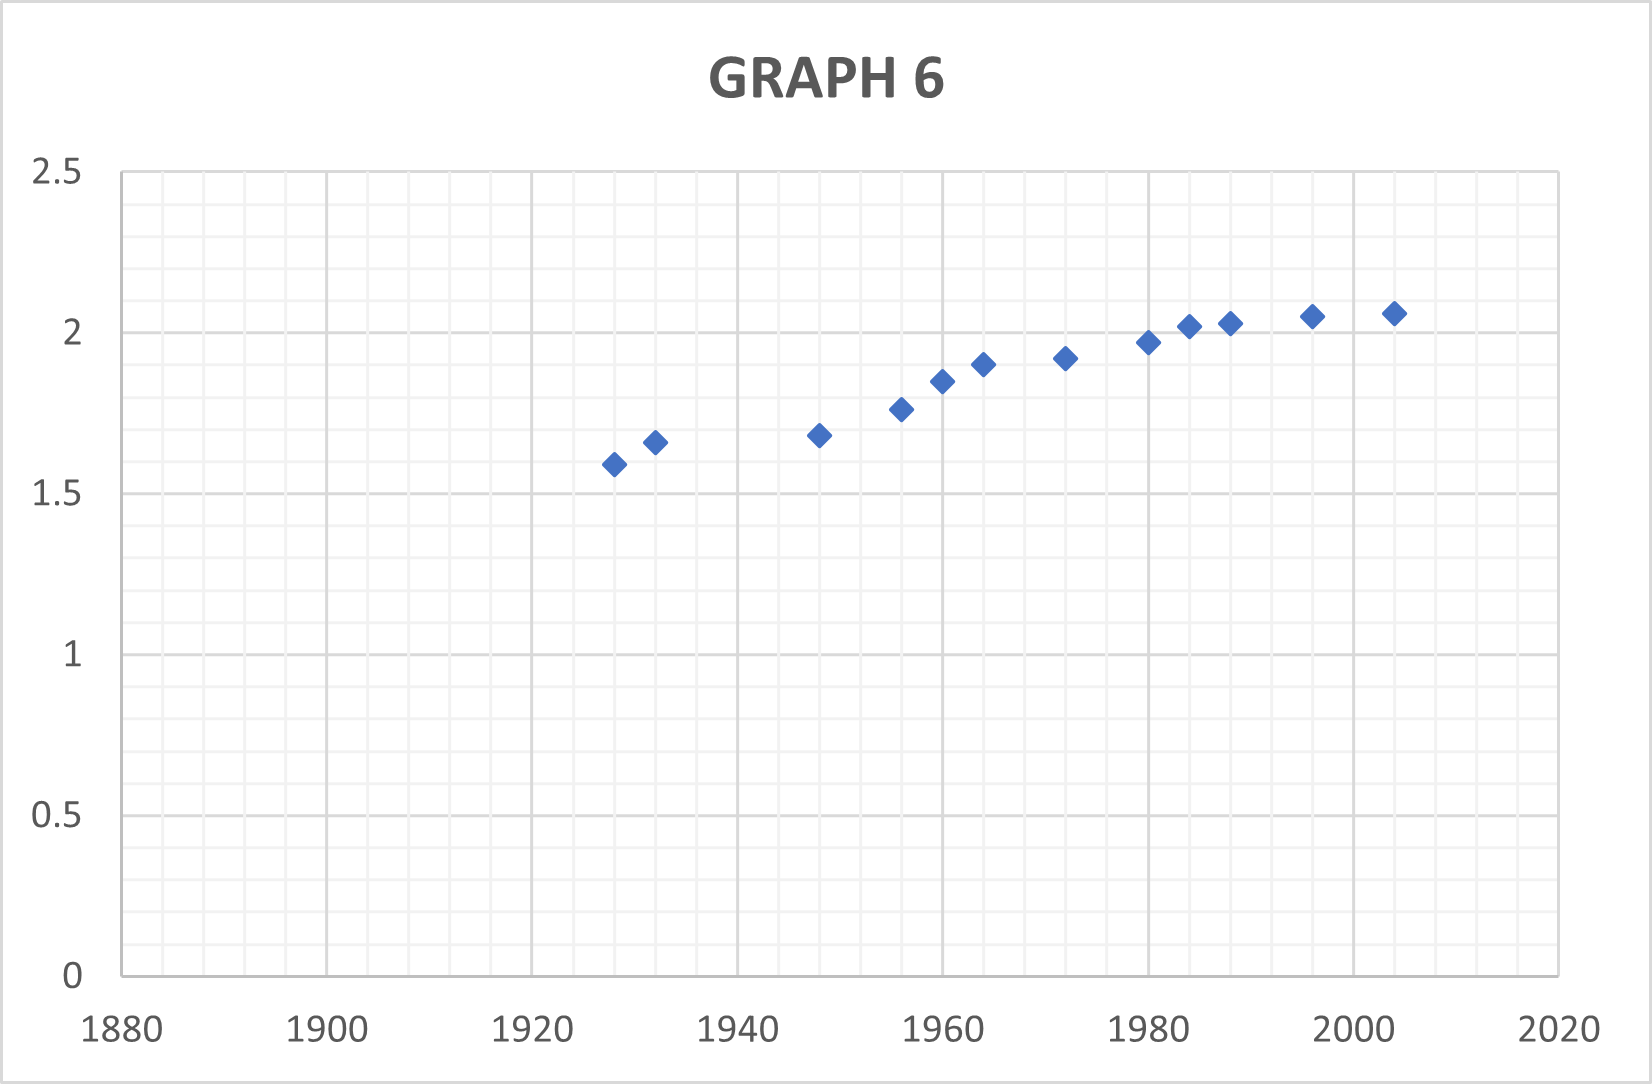
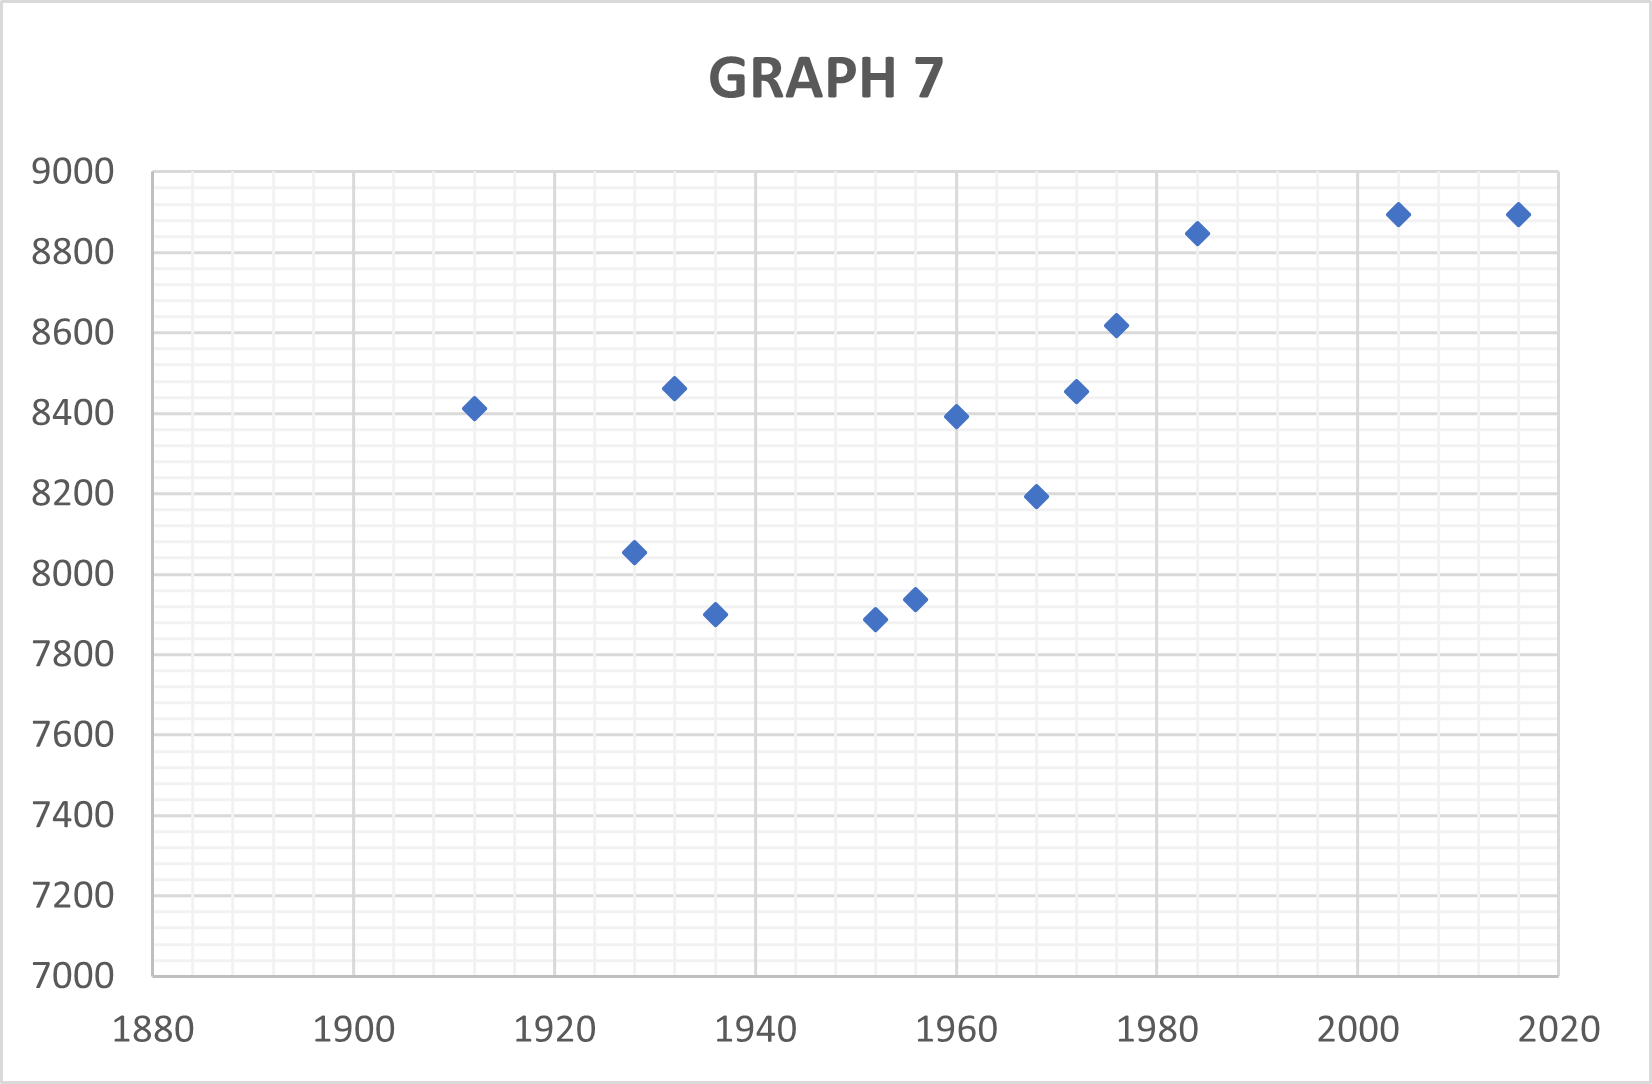
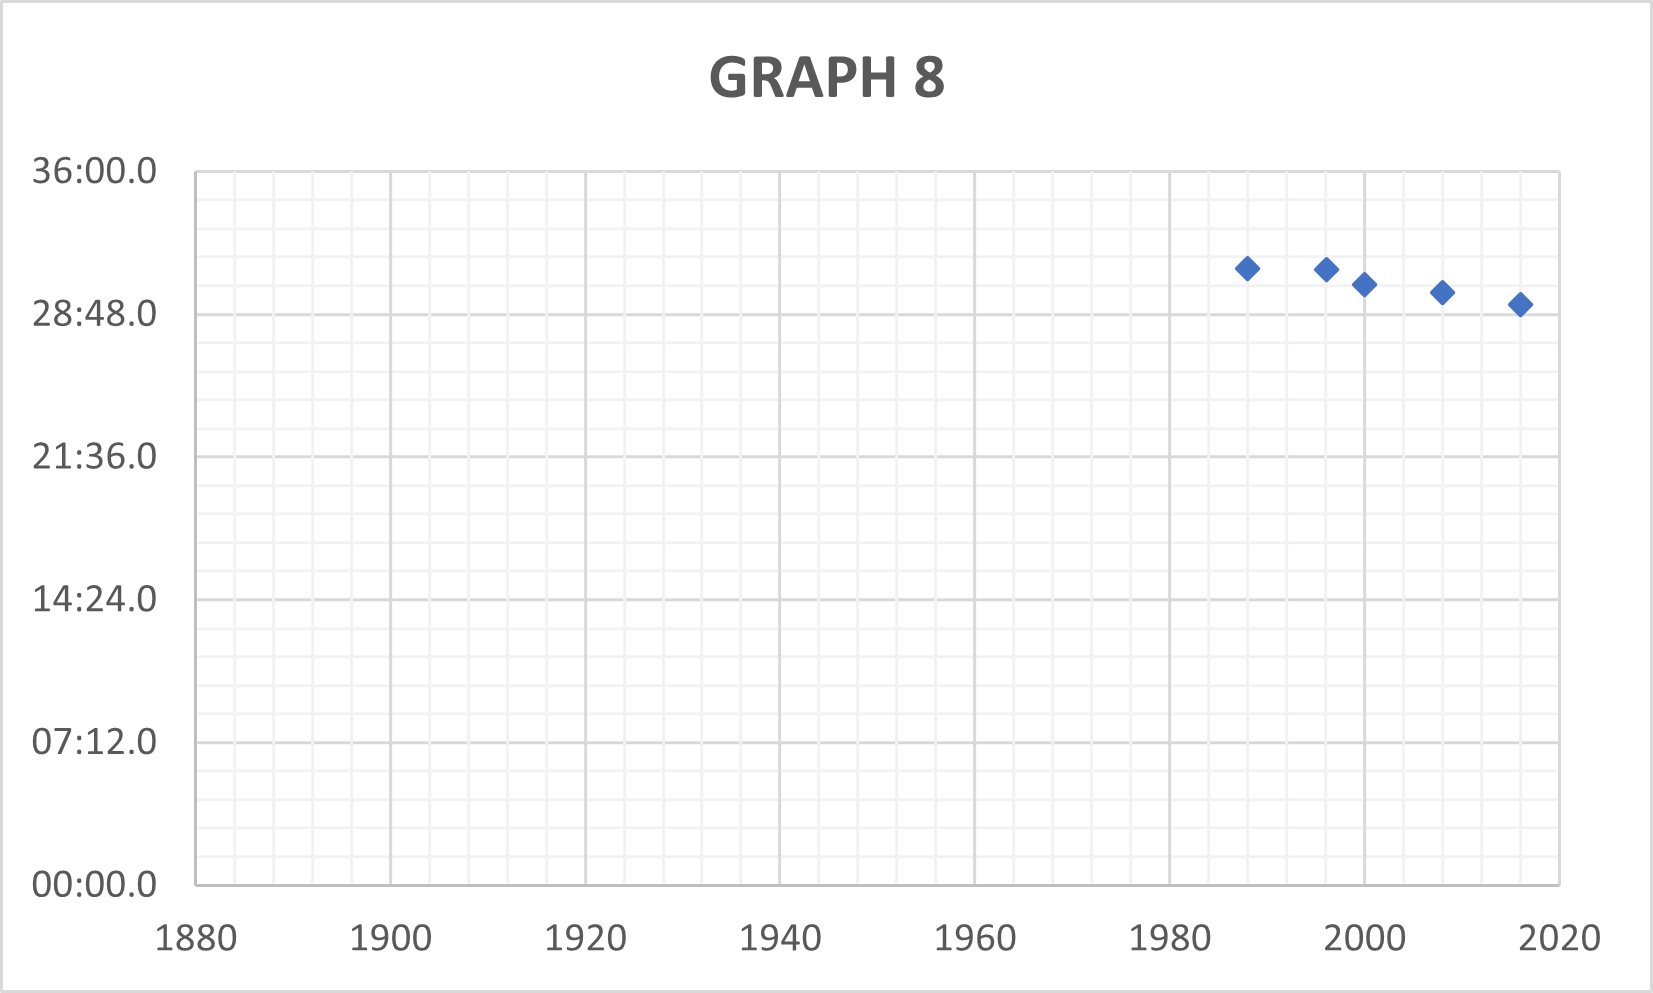
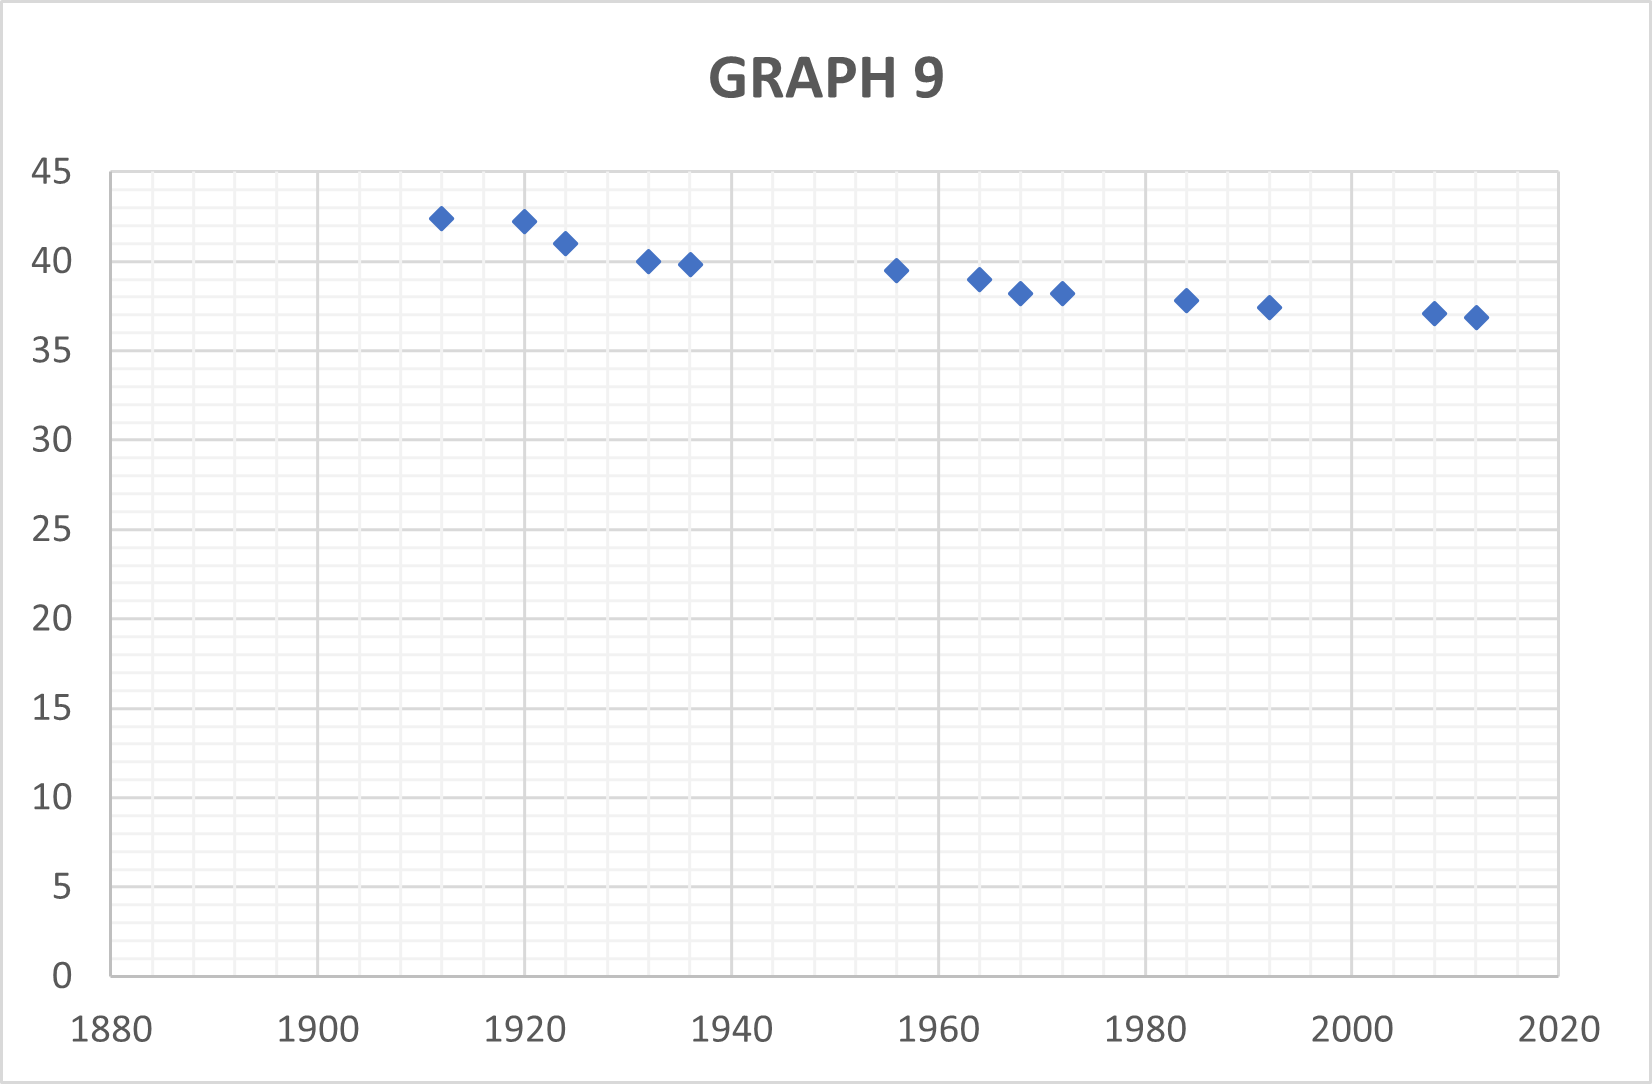
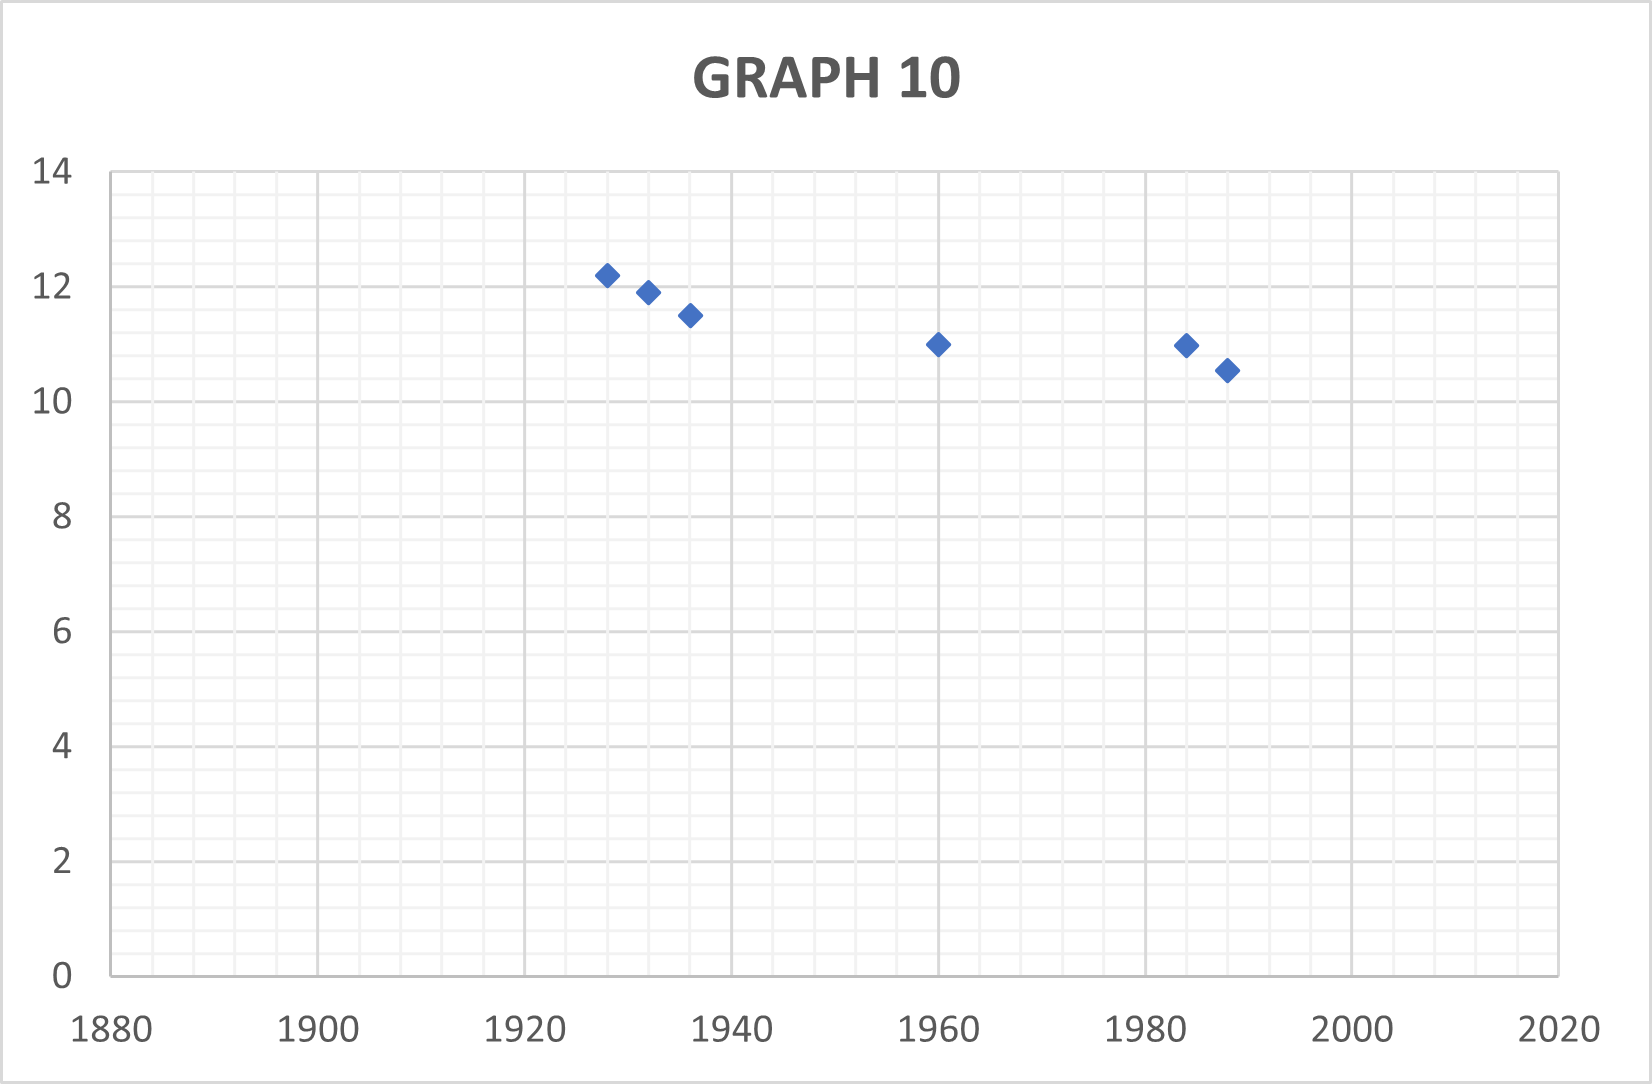
Here are ten graphs showing how Olympic records have changed over time in ten athletic events.
Can you deduce which event each graph represents?
You can click on the thumbnails above to view each graph, or download this pdf or this powerpoint with all the graphs.
Here are some questions to consider, which may help you to make sense of the graphs:
- Can you determine what the units might be on the vertical axis for each graph?
- Why do some graphs show a decreasing trend and some an increasing trend?
- Are there any unusual features in any of the graphs? Can you think of a plausible explanation for them?
Thanks to Alan Parr for suggesting this problem.