Copyright © University of Cambridge. All rights reserved.
'The History of Trigonometry- Part 1' printed from https://nrich.maths.org/
Show menu
Early Astronomy and the Beginnings of a Mathematical Science
This is the first of three articles on the History of Trigonometry. Part 2 can be found here. Some of the terms used in this article are described in more detail here.
1. Ancient Instruments and Measuring the Stars
The most ancient device found in all early civilisations, is a "shadow stick". The shadow cast from a shadow stick was used to observe the motion of the Sun and thus to tell time. Today we call this instrument a Gnomon. The name gnomon comes from the Greek and refers to any L-shaped instrument, originally used to draw a right angle.
In Euclid Book II, where Euclid deals with the transformation of areas, the gnomon takes the form of an "L-shaped" area touching two adjacent sides of a parallelogram. Today, a gnomon is the vertical rod or similar device that makes the shadow on a sundial.
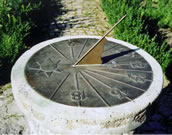
For more about sundials go to Leo's article - Brief History of Time Measurement.
At midday the shadow of a stick is shortest, and the civilisations of Mesopotamia, Egypt, and China took the North - South direction from this alignment. In contrast, the Hindus used the East - West direction, the rising and setting of the sun, to orient their "fire-altars" for religious practices. To do this they constructed the "gnomon circle" whose radius was the square root of the sum of the square of the height of the gnomon and its shadow [See Note 2 below].
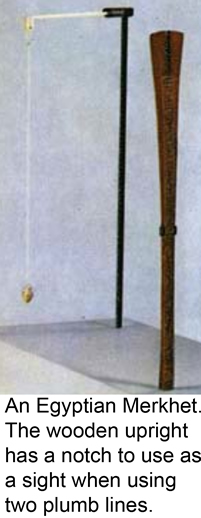
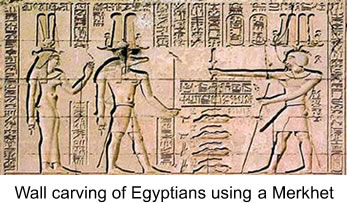
The Merkhet is one of the oldest known astronomical instruments. It was developed around 600 BCE and uses a plumb line to obtain a true vertical, as in the picture. The other object is the rib of a palm leaf, split at one end to make a thin slit for a sight. Babylonian and Egyptian astronomers were able to measure the altitude and lateral displacement of heavenly objects from a particular
direction by using a Merkhet, thus giving the earliest ideas of turning, or angle.
2. Babylonian Astronomers
Observations of celestial bodies by the Babylonians from about 1,800 BCE gave rise to the eventual division of the circle into 360 degrees, and by about 500 BCE, the division of the heavens into twelve regions of 30 degrees each, often referred to as the 12 houses of the zodiac. The Babylonians recorded the events of the lunar month, the daily movement of the sun across the sky over the year, and the rising and setting of the major planets. So, by 750 BCE astronomers had a reasonably accurate means of measuring the elevation (latitude) and lateral direction (longitude) of all objects in the heavens. They built up an extensive collection of data, and made tables of the positions of objects in the sky at any given time through a year (these tables are called ephemerides).
- the constellations of the zodiac completed a full circle through the sky once a year
- the Sun's apparent movement daily across the sky formed $\frac{1}{360}$ of a circle
- the moon moved through about $\frac{13}{360}$ of a circle each day
- the Ecliptic was inclined to the horizon (about $23\frac{1}{2}$ degrees)
- planets were travelling through the starry background in regular paths that were sometimes moving back on themselves in a loop (retrograde)
- eclipses of the moon and the sun could be predicted
- transits of planets (e.g. Venus) moving across the face of the sun, and occultations (where the moon covered the stars) could be observed.
These observations continued over many centuries, slowly becoming more accurate, so that ancient people were able to make star maps, and detect the regular events in the heavens.
Many seasonal phenomena like the flooding of the Nile, or special events like religious ceremonies were linked to astronomical phenomena. The ability to predict some of these major astronomical events gave rise to astrology, where people believed that there was a link between heavenly and earthly events, and that the stars had some control over their lives. See this BBC news item about a prehistoric star map.
The Babylonians and Chinese both believed that the earth and the moon were spherical, that the earth and the moon rotated on an axis, and that the sun and the planets moved in circles round the earth. This enabled them to be able to explain the phases of the moon, and predict eclipses of the moon and the sun by believing that the earth cast a shadow on the moon, and the moon cast a shadow over the sun. They were able to predict paths of other objects across the sun, for example the transit of Venus, a description and explanation of which can be found here on Wikipedia.
The Babylonian astronomers recorded astronomical data systematically and by the Seleucid period (330-125BCE) there were a great many astronomical tablets showing ephemerides for the moon and the major planets. Many of the tablets contain "procedures" or instructions for how to calculate intervals between astronomical events using the properties of simple arithmetic progressions. These procedural processes were the earliest steps of a mathematical astronomy, and both the procedures and the data were used by those who came later. The Babylonians wrote down lists of numbers, in what we would call an arithmetic progression and recognised that numbers repeated themselves over periods of time.
As you can see, Neugebauer published the sexagesimal values for twelve measurements of the position of the Moon taken from a clay tablet dated 133/132 BCE.
In the table above, the top line shows the end of the year 133 BCE with the last month Aires, so the start of the Babylonian year was at the vernal equinox, and the bottom line represents the end of year 132 BCE. The height of the lines on the zig-zag graph below approximately represent the sequence of the numerical values in the table. There are two groups of numbers, one starting with 28, followed by another starting 29. The results for Gemini and Cancer differ only in the third place of sexagesimals and the minimum on the graph is interpolated from the results in the table. Similarly the results for Sagitarius and Capricorn indicate the maximum value for the longitude.
Looking at the first three sets of sexagesimal numbers: 28, 55, 57, 58; 28, 37, 57, 58 and 28, 19, 57, 58 we can notice that the significant differences in the second place between 55, 37 and 19 are all giving a constant 18, which is the difference in height of the vertical lines on the zig-zag graph (except at the minimum and maximum). The graph was drawn to illustrate the periodicity of the data. It is important to realise that the Babylonians recognised the events repeated themselves after some time, but they did not see these results as a 'graph' as we can [see Note 3 below].
The use of graphs as a way of recording the data comes from Neugebauer's book The Exact Sciences in Antiquity.
The Babylonian astronomers recognised the events were periodic but they did not have a theory of planetary motion.
3. The Hindu Sulbasutras
The Sulbasutras are the only early sources of Hindu mathematical knowledge and originally come from the Vedic period (during the second millennium BCE). The earliest written texts we have from this oral tradition date from about 800 BCE. The Sulbasutras are the instructions for constructing various geometrical shapes to make 'fire-altars' using the "Peg and Cord" technique. Each 'fire-altar' was a different shape and associated with unique gifts from the Gods.
For more information on Peg and Cord geometry see: The Development of Algebra Part 1: Section 4 "Early Indian Mathematics" an article by Leo already published on NRICH.
The Vedic people knew how to find the cardinal directions (NSEW). The Sulbasutras gave procedures for the construction of the altars by starting with a line marking the E-W direction (sun rises in east and sinks in the west), thus the E-W direction had special religious significance.
At the end of the fourth century BCE the Indian part of Alexander the Great's empire broke up into small kingdoms run by Indian Greeks. Around this time there was a collection of mathematical knowledge called jyotsia, a mixture of astronomy, calendar calculations and astrology. The rulers still maintained trading links between western India and the Hellenistic culture of the Roman Empire. At this time, Indian horoscope astrology became popular needing precise calendar and astronomical calculations.
The Panca-siddhantica is a collection of five astronomical works composed in the sixth century CE by Vrahamihira. These works contain earlier mathematical knowledge and here we find an approximation for $\pi$ as $\sqrt{10}$, because they used the relationship between the circumference of a circle, $C$ and its diameter $D$ as $D=\sqrt{\frac{C^2}{10}}$. Sines were calculated at intervals of $\frac{30^\circ}{8}$ or $3^\circ45'$, giving a series of values for Sines of angles in the first quadrant and, using the same terms in Sanskrit as the Babylonians for the radius of a circle. Also, the use of similar calculation methods as the Babylonians suggest that this is the earliest surviving Indian sine table. [See Note 4 below]
The method of calculation and the values used by Vrahamihira is very similar to a Greek Chord table for arcs up to $120^\circ$ and intervals of the quadrant into sixths, namely arcs of $15^\circ$. This suggests that the Indian invention of the trigonometry of Sines was inspired by replacing the Greek Chord geometry of right triangles in a semicircle by the simpler Sine geometry of right triangles
in a quadrant [See Note 5 below].
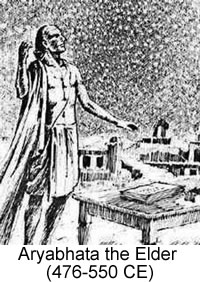
This discovery is much earlier than the account usually given of the sine table derived from chords by Aryabhata the Elder (476-550 CE) who used the word jiya for sine. Brahmagupta reproduced the same table in 628 CE and Bhaskara gave a detailed method for constructing a table of sines for any angle in 1150 CE.
4. Chinese Astronomy
The Chinese were the most accurate observers of celestial phenomena before the Arabs. "Oracle Bones" with star names engraved on them dating back to the Chinese Bronze Age (about 2,000 BCE) have been found, and very old star maps have been found on pottery, engraved on stones, and painted on the walls of caves.
Surviving records of astronomical observations made by two astronomers Shi Shen and Gan De date from the 4th century BCE.
Shi Shen wrote a book on astronomy, and made a star map and a star catalogue. In 364 BCE Gan De made the first recorded observation of sunspots, and the moons of Jupiter and they both made accurate observations of the five major planets. Their observations were based on the principle of the stars rotating about the pole (equivalent to the earth rotating on its axis).
A famous map due to Su Song (1020-1101) and drawn on paper in 1092 represents the whole sky with the positions of some 1,350 stars.
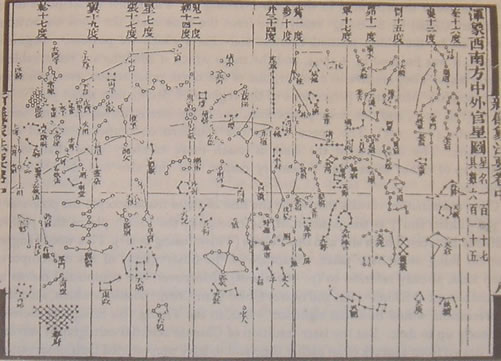
The equator is represented by the horizontal straight line running through the star chart, while the ecliptic curves above it.
The oldest star map found so far is from Dunhuang. Earlier thought to date from about 940 CE, it was made with precise mathematical methods by the astronomer and mathematician Li Chunfeng (602-670) and shows 1339 stars in 257 Chinese star groups with a precision between 1.5 and 4 degrees of arc. In all there are 12 charts each in 30 degree sections displaying the full sky visible from the Northern hemisphere. Up to now it is the oldest complete preserved star atlas discovered from any civilisation. It has been on display this year in the British Library to celebrate 2009 as the International Year of Astronomy. [see Note 6 below]
Some elements of Indian astronomy reached China with the expansion of Buddhism (25-220 CE). Later, during the period (618-907 CE) a number of Indian astronomers came to live in China and Islamic astronomers collaborated closely with their Chinese counterparts particularly during (1271-1368).
Very little of the knowledge of the Indians and the Chinese was known in Europe before the Portuguese navigators and the Jesuit scientist Matteo Ricci in the fifteenth century.
Babylonian astronomy contributed direct empirical data as a foundation for Greek theory and exactly the same data which provided the information for the "zig-zag" data results in Babylonian theory were used to calculate the mean motions of the sun and moon by Hipparchus.
Pedagogical notes to support this article can be found in the Teachers' Notes accompanying this resource.
Explanations for some of the astronomical terms used in this article can be found here.
Part 2 of the History of Trigonometry will take you from Eudoxus to Ptolemy.
References
Katz, V. (1998) A History of Mathematics. New York. Addison Wesley. Recommended as the best general history of mathematics currently available. There is good coverage of aspects of astronomy in antiquity, and the discussion on 'functions' (p. 156) is worth reading. Trigonometry is dealt with in sections on Ancient Civilisations, Mediaeval Europe, Renaissance Europe
Katz, V. (Ed.) (2007) The Mathematics of Egypt, Mesopotamia, China, India, and Islam. Princeton. Princeton University Press. This book contains a wealth of up-to-date information on mathematics and some aspects of astronomy in these ancient civilisations.
Linton, C. M. (2004) From Eudoxus to Einstein: A History of Mathematical Astronomy. Cambridge University Press The first chapter deals with ancient people and early Greek astronomy.
Needham, J. (1959) Science and Civilisation in China. Vol. 3. Mathematics and the Sciences of the Heavens and the Earth. Cambridge University Press.
Neugebauer, O. (1983)(1955) Astronomical Cuneiform Texts. Vol. 1 The Moon. Heidelberg. Springer-Verlag These two books are the big classics on China and Mesopotamia, but much work has been done in these areas since the 1950s.
Neugebauer, O. (1969) (original 1952) The Exact Sciences in Antiquity. New York. Dover Books. Still available, this is a more popular book and contains much information on Egypt, Babylon and Greek Science.
Plofker, K. (2009) Mathematics in India. Princeton. Princeton University Press. This is the most recent book on the history of Mathematics in India by a renowned expert.
Web Links
Wikipedia is quite good for first-level information on early astronomy, and should lead you to more reliable sources. However, more recent work - as found in Katz (2007) is the best generally available today.
The MacTutor site has a topic list and there you can find material on Trigonometry and Greek astronomy, but look also at Geography. In the biography list, you can find Ptolemy, Eudoxus, Menelaos, Brahmagupta and others.
Note 6 below, has a link to the oldest Chinese Star Map
Here is Gary Thompson's huge collection of data on Egyptian, Babylonian, Chinese and other Ancient Astronomy: http://members.westnet.com.au/gary-david-thompson/index1.html
This site shows some of the oldest star diagrams from prehistoric times: http://www.spacetoday.org/SolSys/Earth/OldStarCharts.html
This is a site on Egyptian Astronomy http://www.egyptologyonline.com/astronomy.htm
Here you can find the 'Decan' chart http://www.moses-egypt.net/star-map/senmut1-mapdate_en.asp
Notes
- The radius of the circle depends on the time of year. The truest E - W direction will be achieved by marking the end of the shadow at sunrise and sunset (possibly at the equinoxes). As long as the times of marking the shadow after sunrise and before sunset are the same, the true E - W direction could still be found. In the surviving documents, there are no diagrams, and the instructions are somewhat ambiguous. These ancient people knew that the diagonal of any rectangle was the square root of the square on the hypotenuse of a right triangle by at least 2,000 BCE. At that time, the square root of the square on the hypotenuse was conceived of as the length of a rope i.e. the side of the square, not a numerical result, as we think of it today.
- The ecliptic is the apparent path of the Sun in the sky throughout the year on the celestial sphere. The angle between the plane of the equator and the plane of the ecliptic is about 23$^\circ$ 26' and is called the obliquity of the ecliptic. Babylonian astronomers recognised the rotation of constellations of stars along the zodiac circle (the ecliptic). The intersections of the celestial equator and the ecliptic are the equinox points where the lengths of the day and night are equal.
- The common unit of measure for these calculations was usually the nidan or cubit (about 50 cm.) but other units were used at different times, so there is little consistency from one period to another. 1 degree of arc was about 4 minutes of time and 1 finger was 1/12 of a degree. 30 fingers (but sometimes 24) made 1 cubit. It is thus quite difficult to decide which unit of measure was being used to construct the tables. Angular distances were usually given by naming the constellation and an angle such as: Taurus 23$^\circ$ (= 30$^\circ$ + 23$^\circ$ = 53$^\circ$ ) and Leo 14$^\circ$ (= 120$^\circ$ + 14$^\circ$ = 134$^\circ$ ). In adding and subtracting sexagesimals, we are working in base 60, so if we think of the numbers representing degrees, minutes, seconds, or hours, minutes and seconds they are the same units we use today.
- The use of the capital S in Sine is to show that the radius of the circle used is not unity, or the same as sin $\theta$ in our system, but could be an arbitrary length R. This means that Sin $\theta$ is equal to R sin $\theta$.
- The exact dating of this 'table of Sines' is uncertain. These texts were regularly being revised and added to by different scholars. The similarity in the calculation to the Greek table of chords from Hipparchus (190-120 BCE) (we know his data came from the Babylonians) suggests that this Indian work appeared some time in the first century CE. Did the data in the Indian table come directly from the Babylonians, or via the Greeks? Nobody knows for sure. The important point is that the Indians made the technical and conceptual change from 'Chord' to 'Sine'.
- The Dunhuang star chart, now in the British Library, is recognised to have been made about 649-84 BCE by Li Chunfen (602-670) and was constructed with quite remarkable accuracy. The Dunhuang project is an international archaeology project and much more information about the project and its discoveries can be found at http://idp.bl.uk/ and the star chart http://apod.nasa.gov/apod/ap090619.html.