Copyright © University of Cambridge. All rights reserved.
'Maths Filler 2' printed from https://nrich.maths.org/
Show menu
This problem follows on from the problem Maths Filler 1, although it can be attempted independently from this.
A vessel is constructed from a connected sequence of block-letters (assume that corners of the vessel lie either on grid vertices or half way between grid vertices). Water is poured slowly into the hole on the left (marked in blue) at a rate of 1cm$^3$ per minute.
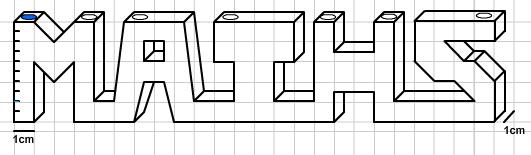
A scale on the left of the vessel measures the height $H(t)$ of the pool of fluid which forms.
How long will it take to fill the vessel to reach each of the markers on the left hand side?
Use this to plot an approximate height-time chart.
Extensions: Think about the issues involved in drawing a completely accurate height-time chart.
How would the chart change if we were to fill through a different hole?