Copyright © University of Cambridge. All rights reserved.
'A Close Match' printed from https://nrich.maths.org/
Show menu
Two functions $f(x)$ and $g(x)$ were plotted on the same axes, where
$$
f(x) =\left(\frac{a}{x}\right)^x\quad \quad g(x) = b\exp\left(-\frac{(x-c)^2}{d}\right)
$$
I chose the coefficients $a, b, c$ and $d$ so as to make the function $g(x)$ match $f(x)$ 'as closely as possible' for points past the maximum of $f(x)$. My resulting charts were as follows.
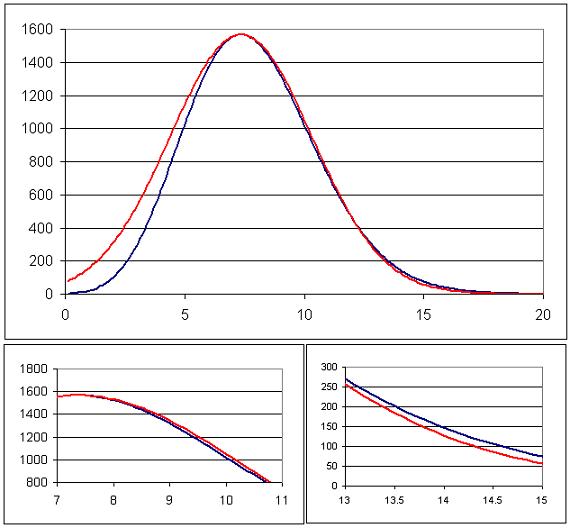
Is it possible to approximately work out the values I chose? Can you choose values to obtain a closer match between the two?
Did you know ... ?
Curve fitting/matching is big business in financial mathematics, where the goal is to be able to quote prices for non-liquidly traded products. To do this you need volatility and interest rate curves which are found by interpolating in some clever way between data points obtained from the price of standard (vanilla) traded products. For tractible mathematical analysis it often helps to try to base these curves in some sense on standard mathematical functions.
Curve fitting/matching is big business in financial mathematics, where the goal is to be able to quote prices for non-liquidly traded products. To do this you need volatility and interest rate curves which are found by interpolating in some clever way between data points obtained from the price of standard (vanilla) traded products. For tractible mathematical analysis it often helps to try to base these curves in some sense on standard mathematical functions.