Copyright © University of Cambridge. All rights reserved.
'Which Spinners?' printed from https://nrich.maths.org/
Show menu
Which Spinners? printable sheet - bar graphs
In the interactivity below there are two spinners.
When you press "One spin", the computer spins them once and adds (or finds the difference between) the numbers.
You can also spin 100 or 500 times at once. The interactivity records the results in the relative frequency chart.
Warning - the computer needs a little bit of thinking time to do 500 spins!
Experiment with different pairs of spinners.
What features do you notice on the bar charts that you produce?
Can you come up with ways of predicting what a chart will look like before you produce it?
The challenge
The bar charts below were generated on the interactivity using different combinations of spinners.
Can you deduce which spinners were used to create each bar chart?
Can you explain how you used the information provided by the bar charts to work it out?
(You can download all eight bar charts here, or click on each chart to see a bigger version)
| A |  |
B |  |
| C | 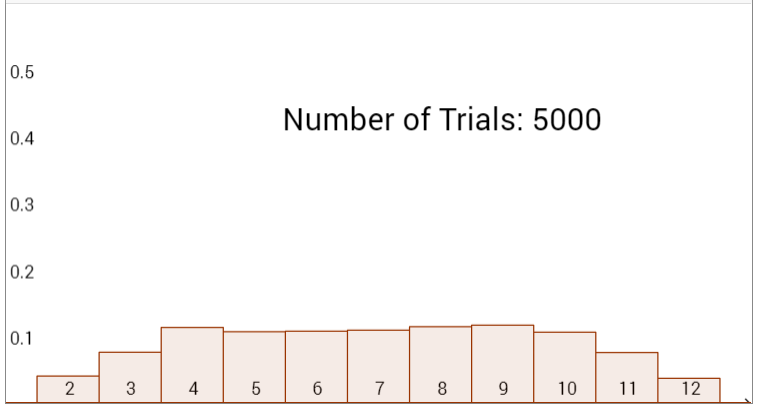 |
D | 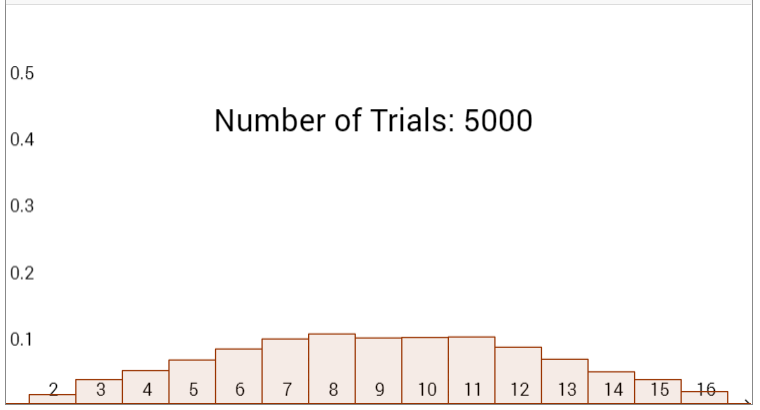 |
| E |  |
F | 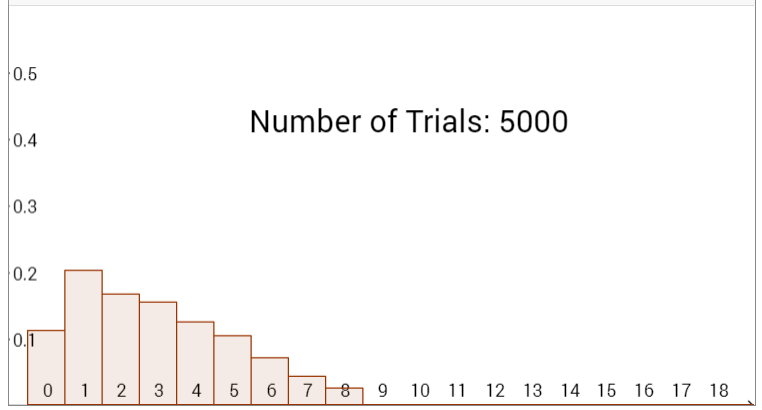 |
| G | 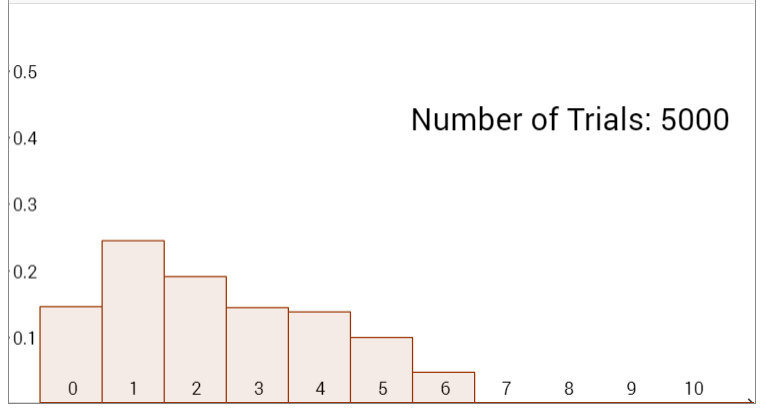 |
H | 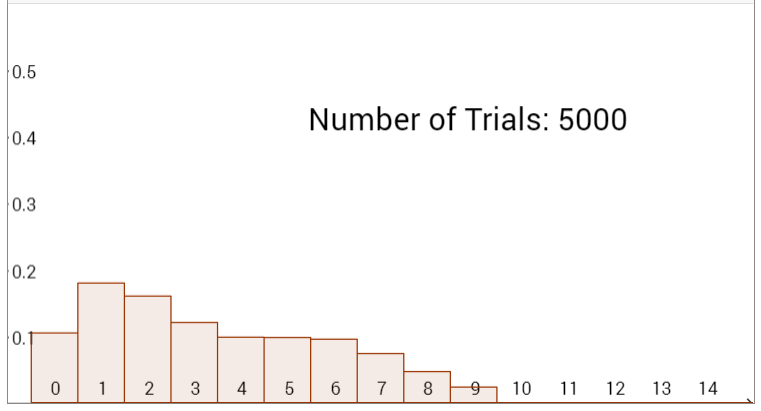 |
Final challenge
Imagine you had 1-20 and 1-30 spinners. Describe in as much detail as you can what the relative frequency bar charts would look like for:
- The sum of two 1-30 spinners
- The difference between two 1-20 spinners
- The sum of a 1-20 and a 1-30 spinner
- The difference between a 1-20 and a 1-30 spinner
Try to provide a good explanation to convince us that your descriptions of the bar charts are correct.
This resource is part of the collection Statistics - Maths of Real Life