Links to the University of Cambridge website
 Links to the NRICH website Home page

Nurturing young mathematicians: teacher webinars
30 April (Primary), 1 May (Secondary)
30 April (Primary), 1 May (Secondary)
Spot the Difference
Age 16 to 18
ShortChallenge Level 

I used a graphical package to draw these 3 pairs of curves on the same set of axes:
$x + y -1 =0\quad\mbox{and}\quad (x+y-1)(x^2+y^2)=0$
$x + y = 0\quad\mbox{and}\quad (x + y)(y^2+(x+1)^2)=0$
$x + y = 1\quad\mbox{and}\quad x^3 + 3xy + y^3 = 1$
I was surprised to find that only 2 graphs appeared to show on the output:
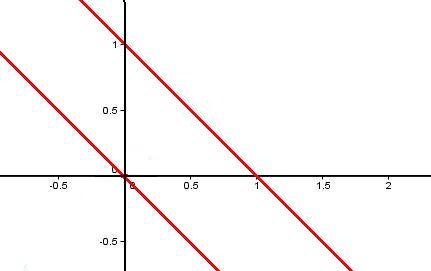
Can you explain what has happened? Can you work out which curves go with which lines? Are there any points missing from the graphs? If so, where should these be?
Can you think of any others sets of curves which might fool the computer?