Copyright © University of Cambridge. All rights reserved.
'Real Statistics' printed from https://nrich.maths.org/
Show menu
Real Statistics
Census at School is an international project which collects data from children in participating countries all around the world, and makes it available for anyone to look at.
The table below contains data that was collected from the first questionnaires in Autumn 2000 and includes responses from children in England, Wales and Northern Ireland. It shows how pupils travel to school:
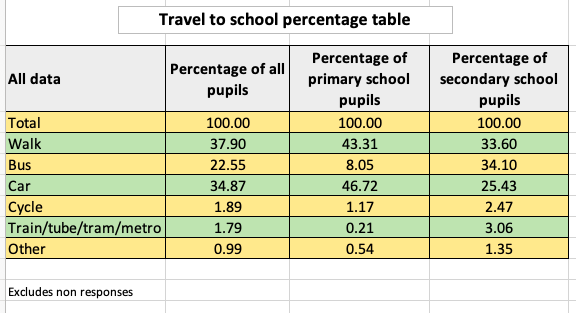
Which is the most popular way of getting to school for primary pupils?
How about for secondary pupils?
Can you think of any reasons why these might be different?
Which is the most common way of travelling to school overall?
Can you explain why this answer is different again?
What do you think the 'Other' category means?
What questions would you like to ask about the data?
Conduct your own survey on how everyone usually gets to school, perhaps in your class or year group.
Present your results in a table, chart or graph and please send it in to us.
Compare your findings to those in the table (you might want to look just at the primary school or secondary school data, depending on how old you are).
How are your results different?
Are there any similarities?
Can you think of any reasons why your findings might be different or similar?
Why do this problem?
Possible approach
Key questions
How will you collect your own data?
Will you ask everyone individually?
How will you record what they say?
How many people are you going to ask?
How will you work out the percentage of people using each method of travel?
Possible extension
Children could be encouraged to interrogate other surveys in newspapers or magazines in a similar way. You could collect some suitable articles for them to look at and challenge them to ask questions about the data presented.
Possible support
Software packages can help pupils present their findings in a number of different ways.