Copyright © University of Cambridge. All rights reserved.
'Speeding Up, Slowing Down' printed from https://nrich.maths.org/
Show menu
Speeding Up, Slowing Down printable sheet
Take a look at the interactivity below which shows regular polygons "rolling" along the horizontal surface. It leaves a trace of the path of the dot and on the graph it records the speed of the travelling dot.
Experiment by positioning the dot at the centre of the polygons, at one of the vertices or at the centre of one of the sides of the polygons and explore how this affects the speed / time graph.
Challenge:
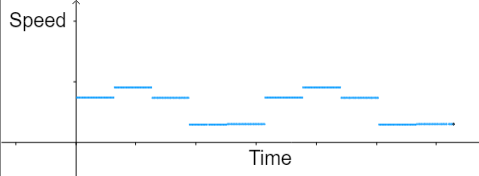
Can you now work out what produced the following speed / time graph?
Can you work out how many sides the polygon had and where the dot was placed?
Try to explain how you worked it out.