Copyright © University of Cambridge. All rights reserved.

'You Never Get a Six' printed from https://nrich.maths.org/

Show menu

You Never Get a Six


It was raining and Tom, Vincent, Charlie and Edward had been playing a game with dice during break.

"You never get a six when you want one," grumbled Charlie, "I'm sure sixes come less than the other numbers!"

a die

Miss Brown heard him.

"You can all try throwing dice and noting what you get," she said, "It fits in quite well with the work we are going to do next. Throw the dice and make a list of what you get. See if you get less sixes then."

"It's only when it matters if you get a six," grumbled Charlie.

Miss Brown thought for a moment.

"I'll give a Team Point to the one who gets the most sixes," she said, "Mind you, no cheating!"

"Wow!" exclaimed Vincent.

The boys worked in pairs and made lists of their throws. They all threw the dice the same number of times. Here is the list that Tom made for Edward's throws:

tally chart to show throws of die

They decided to make each of the numbers on the dice a different colour when they recorded the work so they could compare them easily.

Here is the graph Edward made from his figures:

bar chart to show throws of die


Here is Charlie's unfinished graph (he hasn't labelled anything yet):


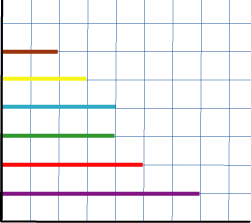
Here is Tom's unfinished graph:

scatter graph to show throws of die


Here is Vincent's unfinished pie-chart:

pie chart to show throws of die


Who won the Team Point for the most sixes?

How many $1$s, $2$s, $3$s, $4$s, $5$s and $6$s were thrown altogether?

What percentage (or: How many out of $100$) of the throws were sixes?


Click here for a poster of this problem.

Why do this problem?

This problem challenges learners to interpret data carefully and to search for all the information that there is implicit in any graphical representation. The question encourages them to contrast different ways of representing similar data and helps to make explicit their interpretation of what the data represents in order to solve the problem.

Later on in secondary school children often leave out the labels on axes so rendering the representation meaningless. This question will help children to realise the significance of the labels.

Possible approach

You could get the group to make about sixteen throws of a die and make a rough bar chart of the results of the throws on the board. Then give a brief introduction to the problem as given '?? just reading will probably be sufficient.

After this learners could work in pairs on the actual problem from a computer or a printed sheet so that they are able to talk through their ideas with a partner.

At the end of the lesson you should discuss not only the answers to the problem itself, and how these were reached, but also to stress why it is important not to leave out the labels on axes of a graph.

Key questions

What number does green (etc) represent?
What colour is six (etc)?
How can you label this axis?
How many times did they all throw the dice?

Possible extension

Learners could make graphical representations of their own dice throws or do How Big Are Classes 5, 6 and 7?

Possible support

Suggest trying The Pet Graph first which is simpler and easier to understand.