Copyright © University of Cambridge. All rights reserved.
'How Big Are Classes 5, 6 and 7?' printed from https://nrich.maths.org/
Show menu
Why do this problem?
This problem encourages learners to contrast different ways of representing similar data, and helps to make explicit their interpretation of what the data represents in order to solve the problem. The task will also help children to realise the significance of labels on charts.
Possible approach
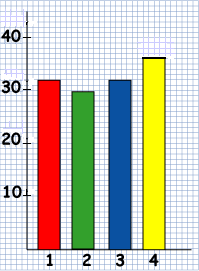
Tell the story of the problem orally, revealing the two representations on the board. Rather than asking the questions straight away, you could invite the class to look at the two charts and consider what they notice, and what they wonder, perhaps in pairs.
You may find that when you bring everyone together again, some learners point out that the key is missing on the pictogram and so once other contributions have been made, you can focus on this part of the challenge.
Give out copies of this sheet, which is a copy of the problem, and invite pairs to work on the task.
In the final plenary, you could discuss not only the answers to the problem itself, and how these were reached, but also stress why it is important not to leave out the labels on axes of a graph!
Key questions
What is a reasonable number to try?
What can you find out about Class 4 from the bar graph?
Can you work out the number that each figure stands for from the two graphs for Class 4?
Possible extension
Learners could make different graphs and representations of the numbers in the classes in their own school.
Possible support
Learners might like to try the task The Pet Graph first, which is more straightforward.

