I used the graphs interactivity with a group of twenty students on a Mathematics Enhancement Course at Liverpool Hope University. The Mathematics Enhancement Course comprises several five-week modules covering various topics within the A-level and undergraduate mathematics curriculum.
The graphs interactivity was used in the second lesson of the Decision and Discrete module where most students were being introduced to graph theory for the first time. A few students had previously met the topic at A level.
The session was held in a computer laboratory in order to allow individual use of the graphs interactivity. I used a PowerPoint presentation to guide the session. Students were first introduced to the definitions of the features of graphs including vertex, edge, region and degree of a vertex.
Then the students were introduced to the graphs interactivity in the Google Chrome browser. The web link was made available in the university VLE, Moodle.
Students explored together how to add/remove a new edge and vertex using the built-in functionality. Initially, some students found it difficult to connect one vertex to another but they soon got the hang of it.
The students’ first task was to explore the relationship between the sum of the degrees of the vertices and the number of edges. They did this by drawing several graphs including simple graphs from which they developed conjectures and then more complex graphs which they used to test their conjectures.
After exploring different types of graphs, I invited students to find the relationship between the number of vertices and number of edges in a tree. Most students adopted a similar strategy drawing simple trees with less than ten nodes and then increasing the number of nodes to about twenty in order to test their conjectures.
After introducing the notion of a complete graph, students explored how many edges there are in a complete graph with n vertices. Students started simply with a triangle and moved up to more complex figures such as an octagon.
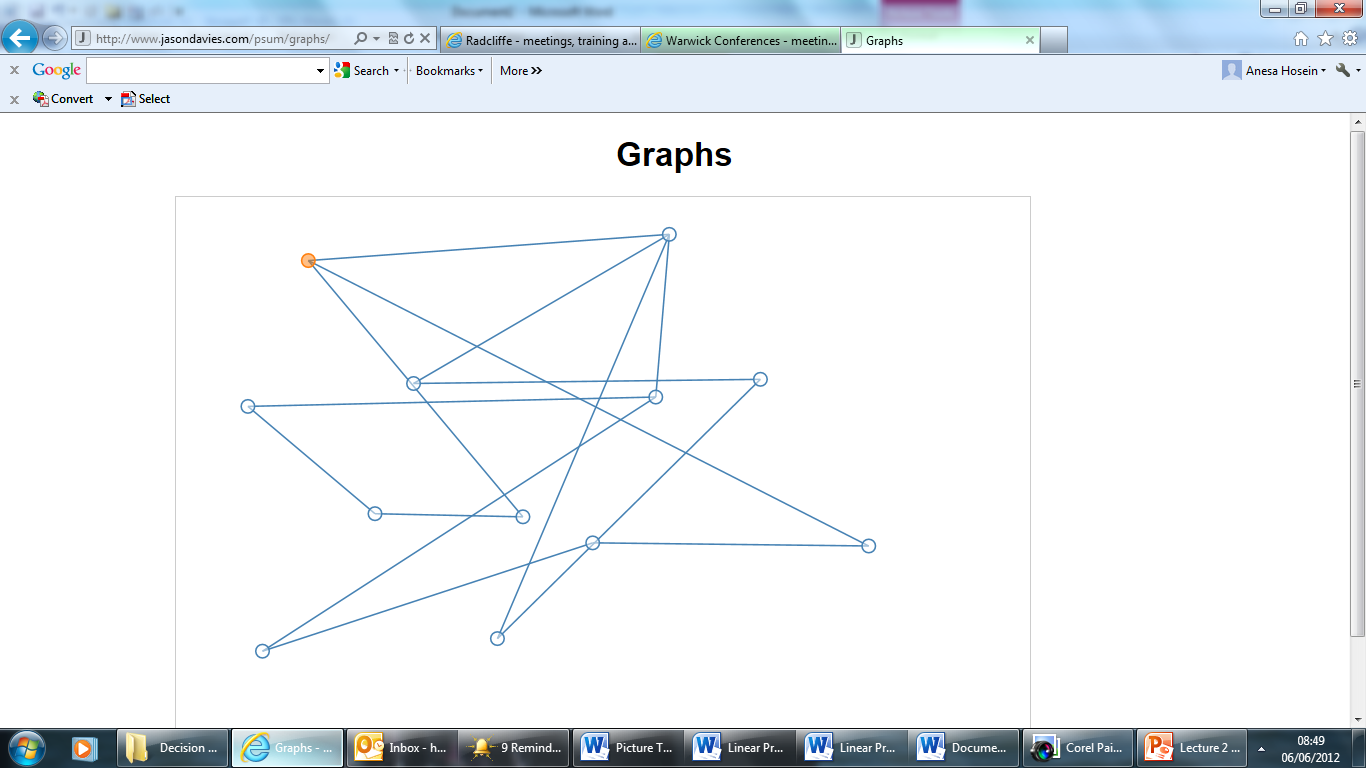
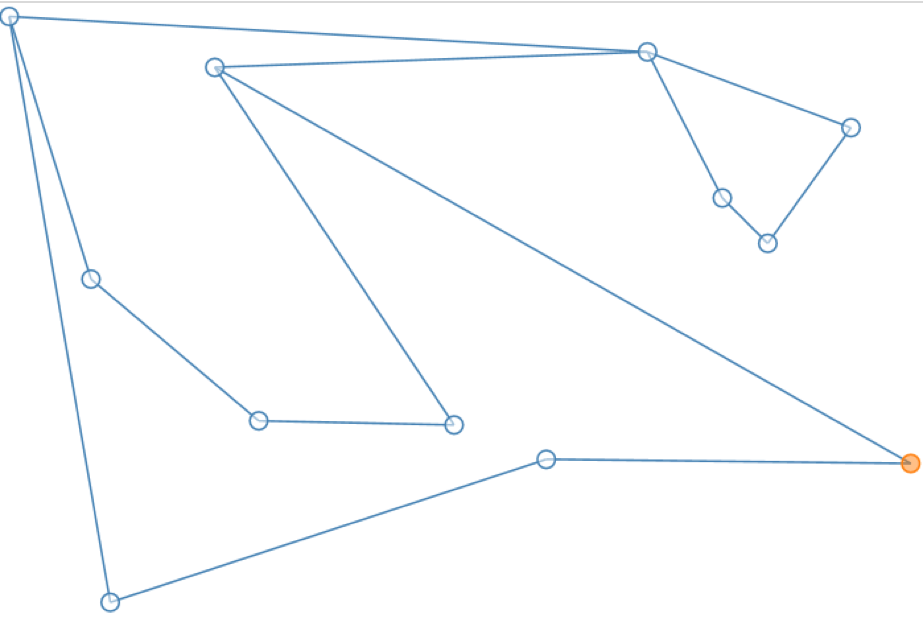
Students also explored planar and isomorphic graphs using the interactivity. They enjoyed doing this particular task, because they liked creating complex graphs and investigating how to manipulate it to become planar, for example:
The students were very imaginative creating graphs. The interactivity provided an accessible introduction to graphs and allowed students to develop understanding of important concepts through exploration.